Bitcoin 15-Minute Chart Analysis
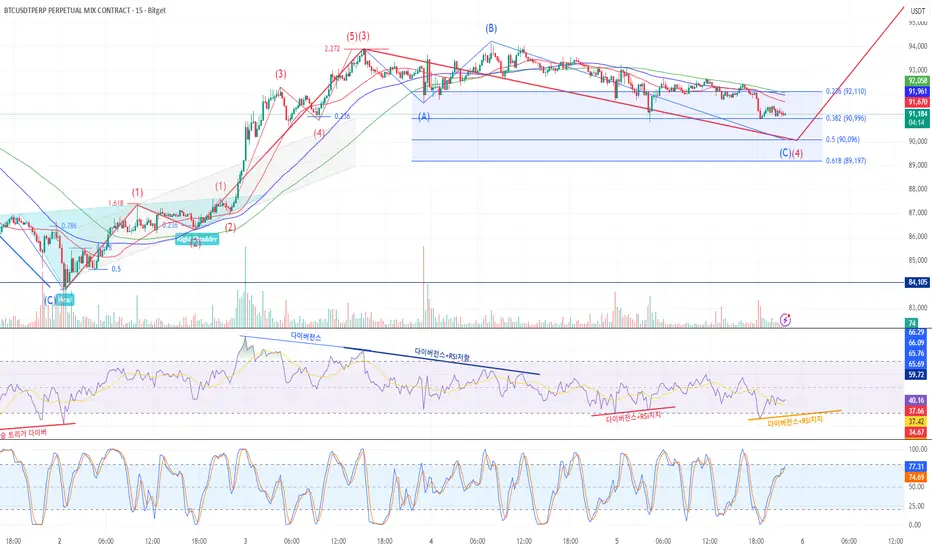
The larger Wave ③ initiated after a breakout above an inverse head and shoulders pattern.
Wave ③ appears to have completed near the 2.272 Fibonacci extension, followed by a divergence, signaling the start of a correction.
A mild A–B corrective rebound occurred, then another drop followed after a second divergence and RSI resistance.
Currently, moving averages remain in a bearish alignment (death cross).
Refer to Fibonacci retracement levels to gauge the depth of Wave ④.
Wave ④ completion will depend on the presence of divergence and RSI support signals.
'규칙' & '패턴' 그리고 '조합'
blog.naver.com/lightvblue
blog.naver.com/lightvblue
Disclaimer
The information and publications are not meant to be, and do not constitute, financial, investment, trading, or other types of advice or recommendations supplied or endorsed by TradingView. Read more in the Terms of Use.