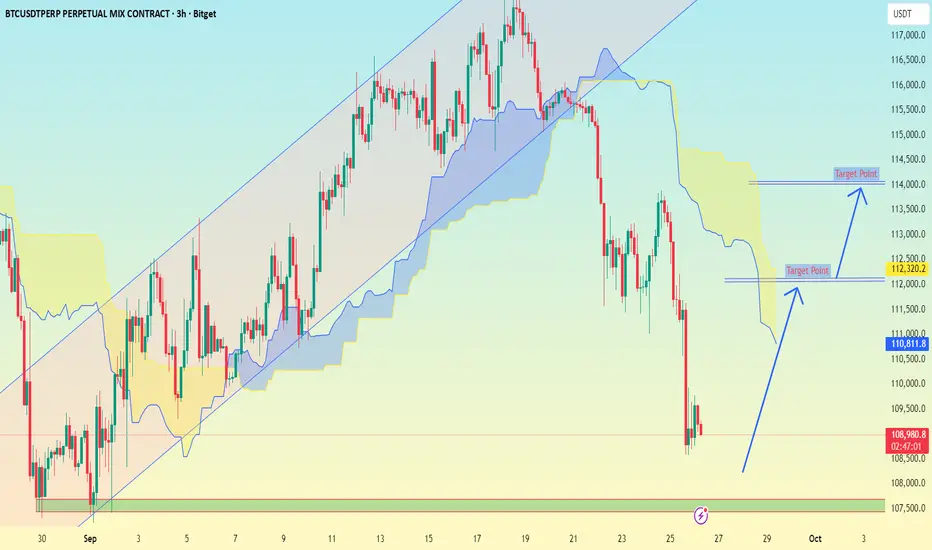
BTCUSDT 3H chart:
Price has broken out of the rising channel and dropped sharply.
It’s now consolidating near 109,000 USDT after testing support.
The Ichimoku cloud shows price trading below the Kumo, but My marked two potential bullish retracement targets.
Targets (based on My chart):
1. First Target Point → 112,300 – 112,500 USDT
This aligns with a minor resistance + the bottom edge of the Ichimoku cloud.
2. Second Target Point → 113,800 – 114,200 USDT
This is higher resistance + mid-section of the Kumo cloud.
📌 So, if BTC holds above 108,500 – 109,000 support, these are likely rebound levels:
TP1: 112,500
TP2: 114,000
⚠ But if 108,500 breaks with strong volume, the bullish recovery setup is invalidated, and downside continuation may happen.
Trade active
trade active Note
1st target donet.me/RSI_Trading_Point4
Forex, gold and crypto signal's with detailed analysis & get consistent results..
t.me/forexofdollarsmagnet
Gold signal's with proper TP & SL for high profits opportunities..
Forex, gold and crypto signal's with detailed analysis & get consistent results..
t.me/forexofdollarsmagnet
Gold signal's with proper TP & SL for high profits opportunities..
Related publications
Disclaimer
The information and publications are not meant to be, and do not constitute, financial, investment, trading, or other types of advice or recommendations supplied or endorsed by TradingView. Read more in the Terms of Use.
t.me/RSI_Trading_Point4
Forex, gold and crypto signal's with detailed analysis & get consistent results..
t.me/forexofdollarsmagnet
Gold signal's with proper TP & SL for high profits opportunities..
Forex, gold and crypto signal's with detailed analysis & get consistent results..
t.me/forexofdollarsmagnet
Gold signal's with proper TP & SL for high profits opportunities..
Related publications
Disclaimer
The information and publications are not meant to be, and do not constitute, financial, investment, trading, or other types of advice or recommendations supplied or endorsed by TradingView. Read more in the Terms of Use.