#Bitcoin Weekly Analysis Update
Last time I published a #BTC analysis was on September 8th — that setup hit only our first take-profit target, and after the October monthly candle opened, price pumped fast with strong momentum to the upside and made a new all-time high (ATH).
In that analysis, I mentioned that if Bitcoin hits a new ATH, the setup becomes invalid, and that’s exactly what happened ✅
After being invalidated, on October 10th, Bitcoin dumped sharply down to around $102,000.
Now let’s look at what the weekly chart shows 👇
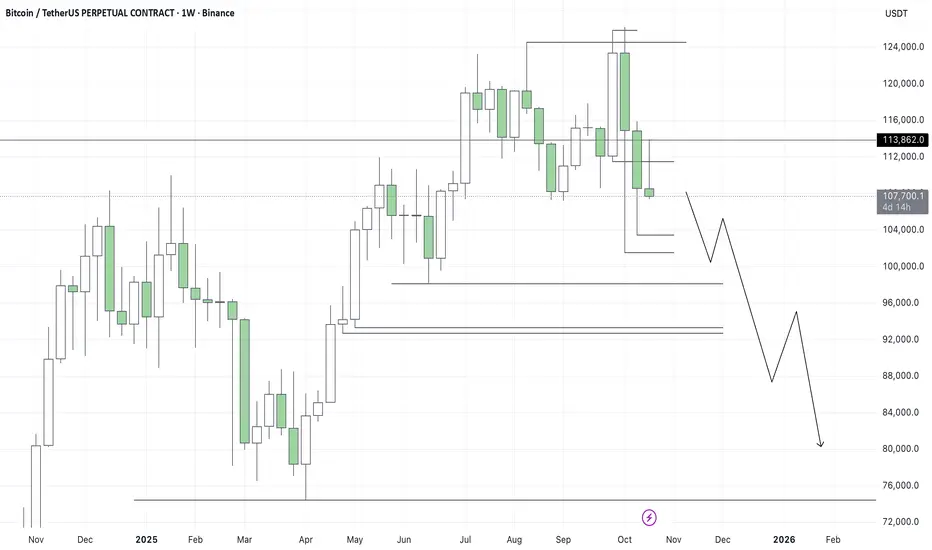
Bitcoin is currently trading around $108,000, and the structure still looks bearish — meaning lower prices are still possible. 🐻
🎯 Targets for this downward move (weekly timeframe):
$103,470 – $101,516 – $98,155 – $94,866 – $92,700 – $86,189 – $76,782 – $74,450
💡 How to trade when the higher timeframe is bearish?
From my experience, when the higher timeframe is bearish, the market usually makes some manipulations above recent highs before dumping again.
After these fake-outs, the best opportunities are usually shorts on pullbacks.
For example, if you check BTC’s chart on October 21st, price pumped on the 4H timeframe, manipulated above the highs, then dumped, giving clean short setups on the retracement.
🗓 I’ll also publish lower timeframe analyses for Bitcoin in the next updates so trading becomes even easier to follow.
🔥 Don’t forget to drop a 👍 reaction under this post — your support gives me energy to keep sharing my best analyses with you all 💪
Last time I published a #BTC analysis was on September 8th — that setup hit only our first take-profit target, and after the October monthly candle opened, price pumped fast with strong momentum to the upside and made a new all-time high (ATH).
In that analysis, I mentioned that if Bitcoin hits a new ATH, the setup becomes invalid, and that’s exactly what happened ✅
After being invalidated, on October 10th, Bitcoin dumped sharply down to around $102,000.
Now let’s look at what the weekly chart shows 👇
Bitcoin is currently trading around $108,000, and the structure still looks bearish — meaning lower prices are still possible. 🐻
🎯 Targets for this downward move (weekly timeframe):
$103,470 – $101,516 – $98,155 – $94,866 – $92,700 – $86,189 – $76,782 – $74,450
💡 How to trade when the higher timeframe is bearish?
From my experience, when the higher timeframe is bearish, the market usually makes some manipulations above recent highs before dumping again.
After these fake-outs, the best opportunities are usually shorts on pullbacks.
For example, if you check BTC’s chart on October 21st, price pumped on the 4H timeframe, manipulated above the highs, then dumped, giving clean short setups on the retracement.
🗓 I’ll also publish lower timeframe analyses for Bitcoin in the next updates so trading becomes even easier to follow.
🔥 Don’t forget to drop a 👍 reaction under this post — your support gives me energy to keep sharing my best analyses with you all 💪
💹 Pro Crypto Setups & Daily Market Insights
📢 Channel: t.me/mrsignalll
📩 Contact me: t.me/the_foundder
🏦 Recommended exchange
Low fees + signup rewards
👉 toobit.com/t/Mrsignal
📢 Channel: t.me/mrsignalll
📩 Contact me: t.me/the_foundder
🏦 Recommended exchange
Low fees + signup rewards
👉 toobit.com/t/Mrsignal
Disclaimer
The information and publications are not meant to be, and do not constitute, financial, investment, trading, or other types of advice or recommendations supplied or endorsed by TradingView. Read more in the Terms of Use.