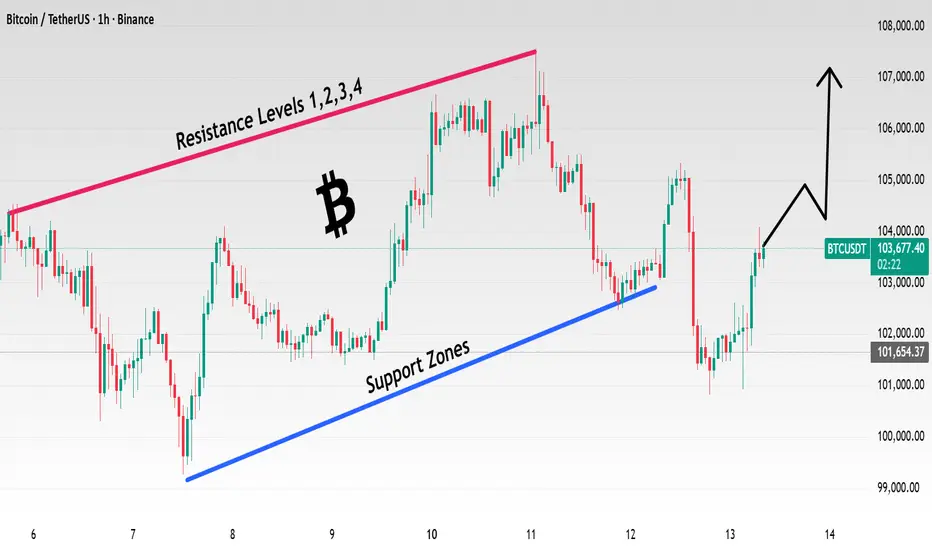
Btcudt is trading near $103,600, showing early signs of recovery after rebounding from the $101,500–$102,000 support area. Price action is shaping an ascending channel, with both boundaries clearly respected.
The recent bounce from the lower boundary highlights renewed demand within the structure. As long as BTC holds above 102,000, short-term momentum may favor further testing of higher resistance zones.
Potential resistance lies near $105,500, $106,800, and $107,000, aligning with the channel’s upper range. A decisive break below 101,500 would invalidate the current bullish structure and shift bias to neutral.
Structure: Ascending Channel
Market Bias: Mildly Bullish (above 102,000)
Key Levels: 101,500 (support), 105,500–107,000 (resistance zones)
Disclaimer
This analysis is for educational purposes only and does not constitute financial advice.
Trade active
More Market updates : Join my telegram channel
t.me/+T-DmNW7QW0k5MTdk
My telegram contact for direct reach to me @swing_trader24
t.me/+T-DmNW7QW0k5MTdk
My telegram contact for direct reach to me @swing_trader24
Disclaimer
The information and publications are not meant to be, and do not constitute, financial, investment, trading, or other types of advice or recommendations supplied or endorsed by TradingView. Read more in the Terms of Use.