Bitcoin (BTCUSDT) has been locked inside a bearish channel since the RSI divergence played out earlier this summer, dragging price into correction. But now things are heating up — BTC has broken the upper channel trendline, showing the first real signs of bullish momentum. RSI is still sitting below 50, signaling caution, yet leaving space for buyers to step in. The big question: is this the start of a new bullish wave, or will Bitcoin stall at resistance and retest support?
Technical Analysis:
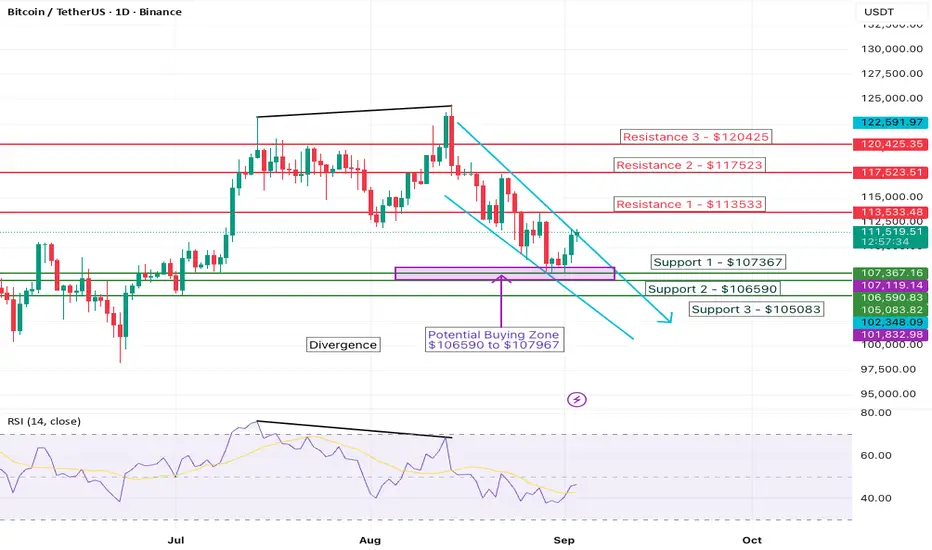
📉 Previous Divergence: The bearish divergence marked earlier worked perfectly, sending BTC lower.
📊 Current Setup: BTC has now broken out of the channel — a bullish sign, but confirmation comes only if price holds above $113,533 (Resistance 1).
🔑 Support Levels: $107,367 → $106,590 → $105,083
🔑 Resistance Levels: $113,533 → $117,523 → $120,425
🎯 Potential Buy Zone: $106,590 – $107,967 (if support holds).
📈 RSI (14): ~46 — below 50 but turning upward, hinting at possible accumulation.
Fundamentals Supporting the Bullish Case:
✅ ETF Demand: Spot Bitcoin ETFs continue to attract billions in inflows, with BlackRock and Fidelity leading. A single day recently saw $1.18B of inflows, pushing BTC higher and squeezing shorts.
✅ Post-Halving Scarcity: The 2024 halving cut miner rewards by 50%, reducing new supply. With 70% of BTC held by long-term holders, supply on exchanges is extremely tight.
✅ Macro Tailwinds: Softer U.S. economic data and potential Fed rate cuts have lifted risk assets, fueling demand for BTC as a hedge.
✅ Institutional Recognition: Bitcoin is increasingly treated as digital gold. Even the U.S. has announced a $120B Strategic Bitcoin Reserve, boosting credibility and long-term confidence.
Do you think Bitcoin’s breakout is the start of a true bullish reversal 🚀 — or will bears push it back to support before the next big move?
#BTC #BTCUSDT #Bitcoin #Crypto #Cryptocurrency #CryptoTrading #CryptoAnalysis #BitcoinPrice #BTCPrice #BitcoinChart #CryptoCharts #TechnicalAnalysis #TA #RSI #Trading #TradingView #ChartAnalysis #PriceAction #CryptoSignals #CryptoTraders #CryptoNews #CryptoCommunity #CryptoWorld #BTCAnalysis #BTCUpdate #CryptoInvesting #CryptoMarket #BitcoinUpdate #CryptoBullish #CryptoBearish #BTCResistance #BTCBreakout #BTCBullish #BTCBearish #SupportResistance #CryptoTrend #CryptoSetup #CryptoTradingSignals #BTCSetup #DigitalGold
⚠️ Disclaimer
This analysis is for educational purposes only and does not constitute financial advice. Trading cryptocurrencies involves high risk; always do your own research and manage your risk accordingly.
Technical Analysis:
📉 Previous Divergence: The bearish divergence marked earlier worked perfectly, sending BTC lower.
📊 Current Setup: BTC has now broken out of the channel — a bullish sign, but confirmation comes only if price holds above $113,533 (Resistance 1).
🔑 Support Levels: $107,367 → $106,590 → $105,083
🔑 Resistance Levels: $113,533 → $117,523 → $120,425
🎯 Potential Buy Zone: $106,590 – $107,967 (if support holds).
📈 RSI (14): ~46 — below 50 but turning upward, hinting at possible accumulation.
Fundamentals Supporting the Bullish Case:
✅ ETF Demand: Spot Bitcoin ETFs continue to attract billions in inflows, with BlackRock and Fidelity leading. A single day recently saw $1.18B of inflows, pushing BTC higher and squeezing shorts.
✅ Post-Halving Scarcity: The 2024 halving cut miner rewards by 50%, reducing new supply. With 70% of BTC held by long-term holders, supply on exchanges is extremely tight.
✅ Macro Tailwinds: Softer U.S. economic data and potential Fed rate cuts have lifted risk assets, fueling demand for BTC as a hedge.
✅ Institutional Recognition: Bitcoin is increasingly treated as digital gold. Even the U.S. has announced a $120B Strategic Bitcoin Reserve, boosting credibility and long-term confidence.
Do you think Bitcoin’s breakout is the start of a true bullish reversal 🚀 — or will bears push it back to support before the next big move?
#BTC #BTCUSDT #Bitcoin #Crypto #Cryptocurrency #CryptoTrading #CryptoAnalysis #BitcoinPrice #BTCPrice #BitcoinChart #CryptoCharts #TechnicalAnalysis #TA #RSI #Trading #TradingView #ChartAnalysis #PriceAction #CryptoSignals #CryptoTraders #CryptoNews #CryptoCommunity #CryptoWorld #BTCAnalysis #BTCUpdate #CryptoInvesting #CryptoMarket #BitcoinUpdate #CryptoBullish #CryptoBearish #BTCResistance #BTCBreakout #BTCBullish #BTCBearish #SupportResistance #CryptoTrend #CryptoSetup #CryptoTradingSignals #BTCSetup #DigitalGold
⚠️ Disclaimer
This analysis is for educational purposes only and does not constitute financial advice. Trading cryptocurrencies involves high risk; always do your own research and manage your risk accordingly.
Disclaimer
The information and publications are not meant to be, and do not constitute, financial, investment, trading, or other types of advice or recommendations supplied or endorsed by TradingView. Read more in the Terms of Use.
Disclaimer
The information and publications are not meant to be, and do not constitute, financial, investment, trading, or other types of advice or recommendations supplied or endorsed by TradingView. Read more in the Terms of Use.