Welcome to My Analysis.
Now, let’s break down today’s Bitcoin structure.
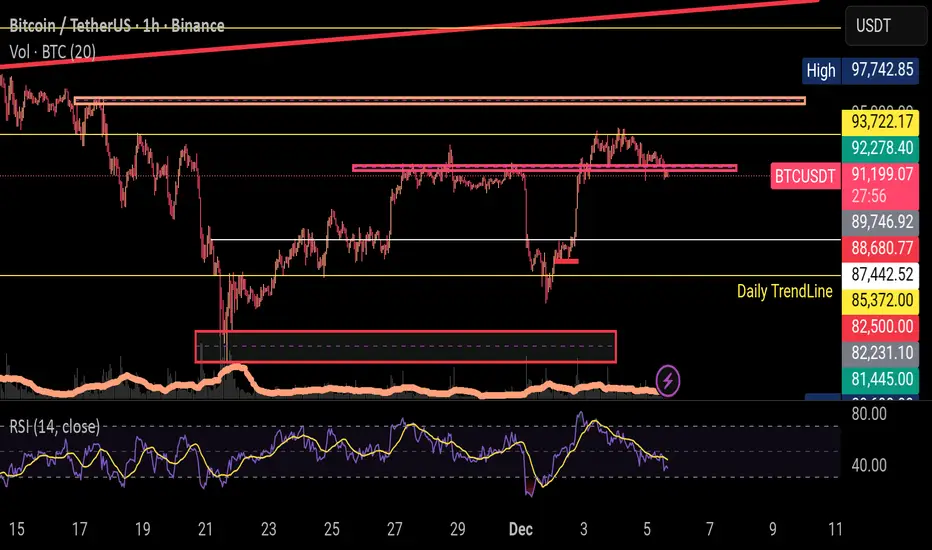
This chart now contains far more important signals than before—especially in terms of market structure, supply & demand zones, and the critical role of the 92–93K resistance.
---
Overall Market Position
Bitcoin is currently in a short-term bearish structure, and the origin of that weakness is very clear:
💥 The drop started precisely from the supply zone at 92,200–93,700.
After multiple taps into this zone:
Price failed to break out
Selling volume increased
Now price is moving right below this major supply area.
---
Market Structure
The pattern on the chart is clear:
SFP of the high → consolidation → heavy drop → pullback → second drop → weak rebound
Which means:
A Lower Low (LL) has formed
A Lower High (LH) has formed
Short-term trend → Bearish
We are at the exact stage where if price closes below the red zone, a new LH will be confirmed and the next drop becomes likely.
---
RSI
RSI is showing a bearish cross below its moving average,
indicating that buyer momentum is weak.
---
Final Summary
Short-term structure is bearish
Price is trading below the strong 92–93K resistance
RSI is bearish with weak momentum
Buyers are weak; sellers are regaining control
Therefore:
Turning bullish before a clean breakout above 94,000 is not logical.
The probability of a drop toward 89,700 and 88,600 is higher than the probability of a rally.
⚠️ Risk Alert ⚠️
Futures are not beginner-friendly. These triggers require solid experience.
Before using them, study risk management and practice with the learning content here.
Now, let’s break down today’s Bitcoin structure.
This chart now contains far more important signals than before—especially in terms of market structure, supply & demand zones, and the critical role of the 92–93K resistance.
---
Overall Market Position
Bitcoin is currently in a short-term bearish structure, and the origin of that weakness is very clear:
💥 The drop started precisely from the supply zone at 92,200–93,700.
After multiple taps into this zone:
Price failed to break out
Selling volume increased
Now price is moving right below this major supply area.
---
Market Structure
The pattern on the chart is clear:
SFP of the high → consolidation → heavy drop → pullback → second drop → weak rebound
Which means:
A Lower Low (LL) has formed
A Lower High (LH) has formed
Short-term trend → Bearish
We are at the exact stage where if price closes below the red zone, a new LH will be confirmed and the next drop becomes likely.
---
RSI
RSI is showing a bearish cross below its moving average,
indicating that buyer momentum is weak.
---
Final Summary
Short-term structure is bearish
Price is trading below the strong 92–93K resistance
RSI is bearish with weak momentum
Buyers are weak; sellers are regaining control
Therefore:
Turning bullish before a clean breakout above 94,000 is not logical.
The probability of a drop toward 89,700 and 88,600 is higher than the probability of a rally.
⚠️ Risk Alert ⚠️
Futures are not beginner-friendly. These triggers require solid experience.
Before using them, study risk management and practice with the learning content here.
Disclaimer
The information and publications are not meant to be, and do not constitute, financial, investment, trading, or other types of advice or recommendations supplied or endorsed by TradingView. Read more in the Terms of Use.
Disclaimer
The information and publications are not meant to be, and do not constitute, financial, investment, trading, or other types of advice or recommendations supplied or endorsed by TradingView. Read more in the Terms of Use.