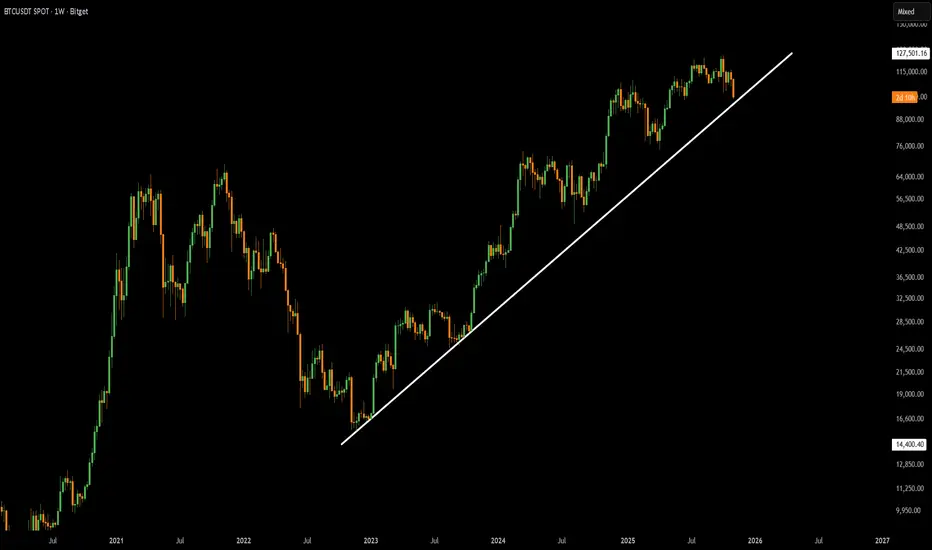
🔍 Bitcoin on Weekly Timeframe Overview.
The trendline connects key swing lows from late 2022 – early 2023 – mid 2024, forming a clean ascending structure.
Price recently corrected from ~$110K to ~$100K but is still well above the trendline, which currently sits around $88K–$90K zone.
🧭 Market Structure
The chart confirms a consistent higher-low and higher-high pattern — a textbook definition of a bullish macro trend.
The recent 9% correction is typical within an uptrend, especially after such extended runs.
The trendline acts as a dynamic support — each touch historically triggered strong bullish reversals.
⚖️ Bias
Macro Bias: Strongly Bullish
The market remains well-structured above the trendline.
Until Bitcoin closes a weekly candle below $90K, the macro uptrend remains fully valid.
The current move looks like a mid-cycle pullback — potentially building energy for the next expansion leg (likely toward $130K–$150K range).
Short-Term Bias: Neutral to Slightly Bearish
There’s visible short-term selling pressure (-9% weekly candle).
If momentum continues, a retest of the $90K–$93K zone (trendline area) is very possible before a rebound.
A clean bounce from that trendline would be a strong buy confirmation signal for long-term investors.
🧩 Key Levels
Support Zones:
$90K → major trendline & confluence support
$95K → psychological and horizontal support
Resistance Zones:
$110K → short-term resistance (recent high)
$127K–$130K → next expansion target zone
✅ Conclusion
The Bitcoin remains in a healthy macro uptrend with strong structural support around $90K.
Unless that trendline breaks decisively, the overall bias stays bullish — this is likely a high-timeframe continuation phase, not a reversal.
Disclaimer
The information and publications are not meant to be, and do not constitute, financial, investment, trading, or other types of advice or recommendations supplied or endorsed by TradingView. Read more in the Terms of Use.
Disclaimer
The information and publications are not meant to be, and do not constitute, financial, investment, trading, or other types of advice or recommendations supplied or endorsed by TradingView. Read more in the Terms of Use.