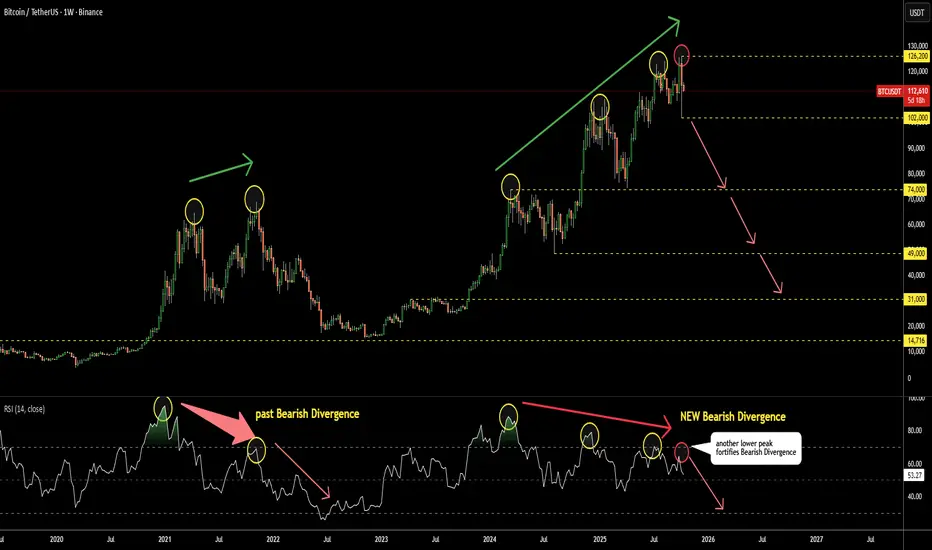
This is a brief update to the analysis shared in August. The RSI has now formed a fourth consecutive lower peak on the weekly chart, further confirming the bearish divergence.
Monitor the RSI closely — a break below 50 (currently at 53) could signal the onset of a bear market.
The first key support level is near 102K, and a decisive move below this level would strengthen the bearish outlook.
Monitor the RSI closely — a break below 50 (currently at 53) could signal the onset of a bear market.
The first key support level is near 102K, and a decisive move below this level would strengthen the bearish outlook.
Related publications
Disclaimer
The information and publications are not meant to be, and do not constitute, financial, investment, trading, or other types of advice or recommendations supplied or endorsed by TradingView. Read more in the Terms of Use.
Related publications
Disclaimer
The information and publications are not meant to be, and do not constitute, financial, investment, trading, or other types of advice or recommendations supplied or endorsed by TradingView. Read more in the Terms of Use.