The Relative Strength Index (RSI) is a simple yet effective indicator, especially when it doesn't follow the market. This situation is called Divergence.
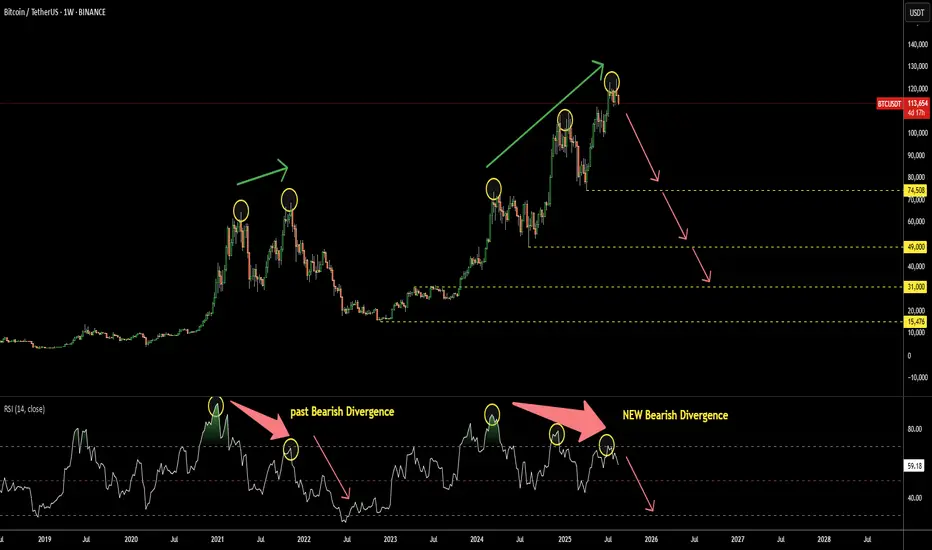
It has recently appeared on the Bitcoin chart as Bearish Divergence. This occurs when the market price makes a new peak, but the RSI, on the contrary, forms lower highs.
Looking back at the same chart, we can rewind to 2021, where a similar Bearish Divergence played out, pushing Bitcoin’s price down heavily from $69k to $15k.
This time, the Bearish Divergence on RSI is more pronounced, as it consists of 3 ascending peaks on the price chart, contrasted with 3 falling tops on the RSI sub-chart.
There are 4 key supports that could underpin the anticipated crash:
1) $74.5k - This year’s bottom
2) $49k - Consolidation low in 2024
3) $31k - Consolidation top in 2023
4) $15.5k - 2022 minimum
Where do you think the crash will stop?
Disclaimer
The information and publications are not meant to be, and do not constitute, financial, investment, trading, or other types of advice or recommendations supplied or endorsed by TradingView. Read more in the Terms of Use.
Disclaimer
The information and publications are not meant to be, and do not constitute, financial, investment, trading, or other types of advice or recommendations supplied or endorsed by TradingView. Read more in the Terms of Use.