📊 Market Anomaly Detector (MAD) – Performance Walkthrough
🔑 Core Concept
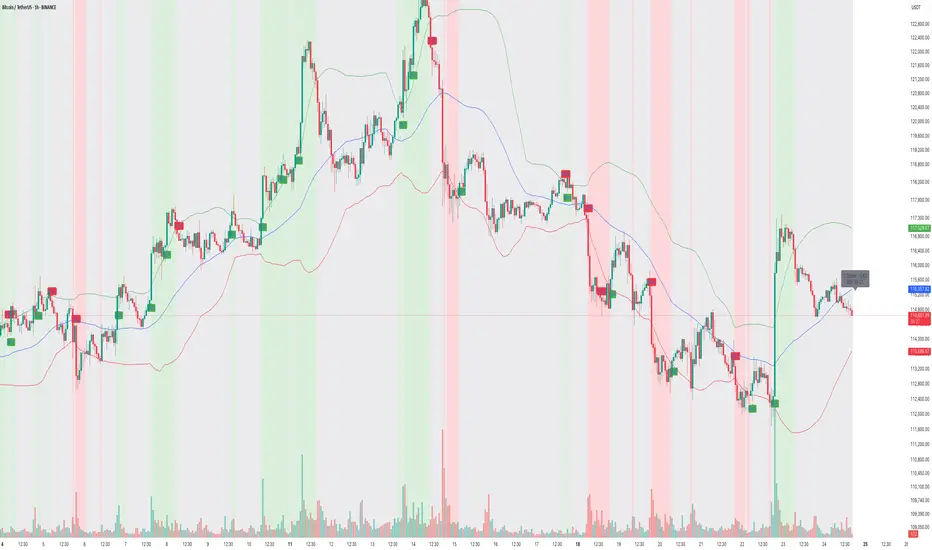
The Market Anomaly Detector (MAD) is designed to spot both trend continuations and reversals using volatility-adaptive bands and a statistical anomaly filter.
• Trend Signals:
• ✅ Buy → when price closes above the upper (green) band.
• ✅ Sell → when price closes below the lower (red) band.
• Reversal Signals:
• 🔄 Sell → when price falls back below the upper (green) band after a breakout.
• 🔄 Buy → when price climbs back above the lower (red) band after a breakdown.
This dual-layer logic helps the indicator capture clean trending moves while also spotting failed breakouts/breakdowns.
⸻
📉 Z-Score Logic – Detecting Market Craze
The Z-Score filter measures how far price activity deviates from its normal behavior:
• 📈 Z > +1 → Market shows bullish strength / craze.
• 📉 Z < –1 → Market shows bearish strength / craze.
• ⚖️ Between –1 and +1 → Market is in neutral / low-momentum mode.
🔎 Current Snapshot (Weekend Session):
• Z-Score = –0.52 → clearly reflects very low momentum.
• Volume is also weak, as is typical during weekends.
• Despite low activity, MAD still adapts and keeps traders aligned with the actual statistical condition of the market.
⸻
🟢 Bullish Examples
• Captured breakout above 118K → 123K with clear momentum.
• Z-Score crossed +1 confirming bullish craze.
🔴 Bearish Examples
• Detected reversal near 121K → 116K with breakdown signals.
• Z-Score dipped below –1, validating the downside momentum.
⸻
🛠 How to Use
1. Look at band breakouts/breakdowns for trade triggers.
2. Watch Z-Score:
• Above +1 → only take bullish signals.
• Below –1 → only take bearish signals.
• Between –1 & +1 → reduce exposure / trade smaller size.
3. Works best on 15m / 1h / 4h with additional filters (VWAP, volume, S/R).
⸻
🎯 Summary
The Market Anomaly Detector (MAD) combines price bands with Z-Score statistics to give traders a 360° view of both market direction and market strength.
• 📊 Captures trends.
• 🔄 Detects reversals.
• ⚖️ Adapts to low-momentum phases (like weekends).
This balance makes MAD a versatile tool for traders who want to stay ahead of both momentum moves and false breakouts.
🔑 Core Concept
The Market Anomaly Detector (MAD) is designed to spot both trend continuations and reversals using volatility-adaptive bands and a statistical anomaly filter.
• Trend Signals:
• ✅ Buy → when price closes above the upper (green) band.
• ✅ Sell → when price closes below the lower (red) band.
• Reversal Signals:
• 🔄 Sell → when price falls back below the upper (green) band after a breakout.
• 🔄 Buy → when price climbs back above the lower (red) band after a breakdown.
This dual-layer logic helps the indicator capture clean trending moves while also spotting failed breakouts/breakdowns.
⸻
📉 Z-Score Logic – Detecting Market Craze
The Z-Score filter measures how far price activity deviates from its normal behavior:
• 📈 Z > +1 → Market shows bullish strength / craze.
• 📉 Z < –1 → Market shows bearish strength / craze.
• ⚖️ Between –1 and +1 → Market is in neutral / low-momentum mode.
🔎 Current Snapshot (Weekend Session):
• Z-Score = –0.52 → clearly reflects very low momentum.
• Volume is also weak, as is typical during weekends.
• Despite low activity, MAD still adapts and keeps traders aligned with the actual statistical condition of the market.
⸻
🟢 Bullish Examples
• Captured breakout above 118K → 123K with clear momentum.
• Z-Score crossed +1 confirming bullish craze.
🔴 Bearish Examples
• Detected reversal near 121K → 116K with breakdown signals.
• Z-Score dipped below –1, validating the downside momentum.
⸻
🛠 How to Use
1. Look at band breakouts/breakdowns for trade triggers.
2. Watch Z-Score:
• Above +1 → only take bullish signals.
• Below –1 → only take bearish signals.
• Between –1 & +1 → reduce exposure / trade smaller size.
3. Works best on 15m / 1h / 4h with additional filters (VWAP, volume, S/R).
⸻
🎯 Summary
The Market Anomaly Detector (MAD) combines price bands with Z-Score statistics to give traders a 360° view of both market direction and market strength.
• 📊 Captures trends.
• 🔄 Detects reversals.
• ⚖️ Adapts to low-momentum phases (like weekends).
This balance makes MAD a versatile tool for traders who want to stay ahead of both momentum moves and false breakouts.
Thanks.
TradeTech Analysis
Telegram Channel - t.me/Tradetech2024
Youtube Channel - youtube.com/@TradeTechAnalysis
Website - tradetechanalysis.com/
Super Profile - superprofile.bio/tradetechanalysis
TradeTech Analysis
Telegram Channel - t.me/Tradetech2024
Youtube Channel - youtube.com/@TradeTechAnalysis
Website - tradetechanalysis.com/
Super Profile - superprofile.bio/tradetechanalysis
Disclaimer
The information and publications are not meant to be, and do not constitute, financial, investment, trading, or other types of advice or recommendations supplied or endorsed by TradingView. Read more in the Terms of Use.