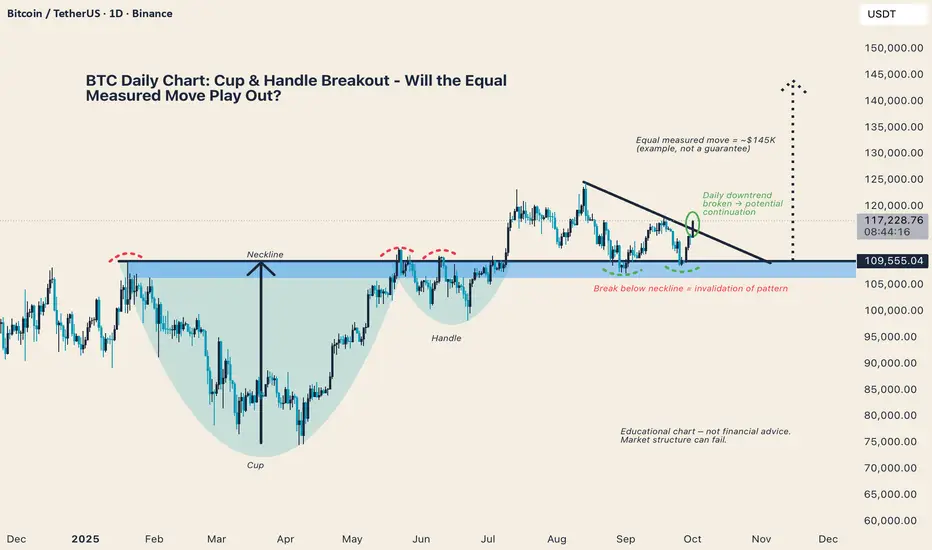
Bitcoin has broken above its daily downtrend while holding above the neckline of a Cup & Handle formation.
Equal Measured Move Example: ~$145K (for educational purposes, not a guarantee)
Key Structure: Sustained closes above the neckline support continuation
Invalidation Level: A decisive break back below the neckline would negate the setup
⚠️ Educational Chart - Market structure can fail. This analysis is for learning purposes only, not financial advice.
What do you think - is this the breakout that pushes BTC into its next leg higher, or will neckline support fail?
Disclaimer
The information and publications are not meant to be, and do not constitute, financial, investment, trading, or other types of advice or recommendations supplied or endorsed by TradingView. Read more in the Terms of Use.
Disclaimer
The information and publications are not meant to be, and do not constitute, financial, investment, trading, or other types of advice or recommendations supplied or endorsed by TradingView. Read more in the Terms of Use.