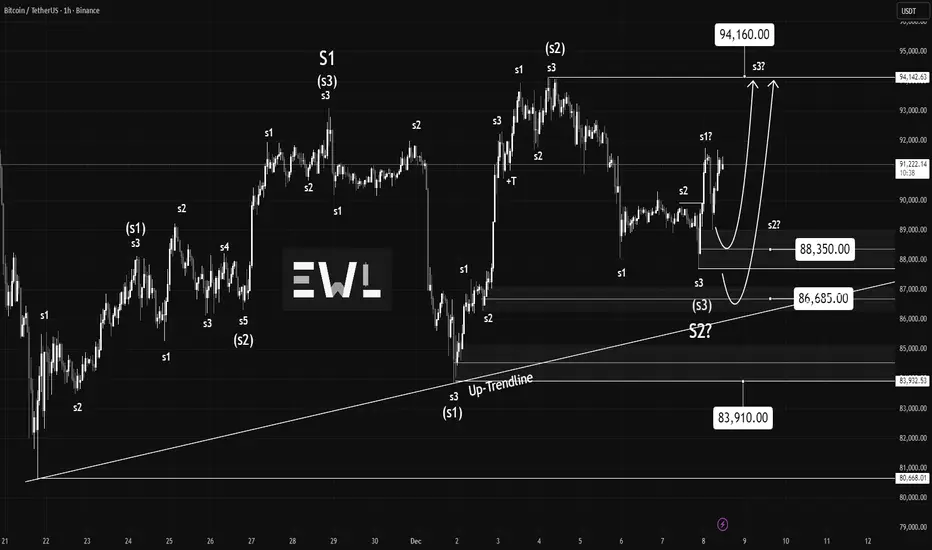
Bitcoin is showing a strong likelihood of pushing up to test the 94,160 level. It’s almost there already. Once price reaches that zone, the next thing to watch is whether it can hold above 94,160. Ideally, it should consolidate and continue higher... not break slightly above the level only to slam back down with force.
If that kind of rejection happens, price would likely swing inside the 94,160–83,910 range again, and that scenario isn’t very promising. The dominant trend that sent price down earlier was bearish, and the current structure is leaning more sideways than decisively bullish, which usually signals continuation to the downside.
But here’s the conflict: the current S1–S2 formation (large degree) is sitting right inside what can only be described as a true “buy the dip” zone .. the same large demand area that previously launched Bitcoin into its prior ATH. It’s a region where buyers naturally step in, and volume can spike hard. The long-term trend still favors the bulls.
This creates a tension between two forces:
- Short-term behavior and Sideways movement hinting at downward continuation.
- Macro context and Price sitting in a deep discount zone aligned with the major uptrend.
With the idea that trend is your friend, the primary bias leans toward looking for buy setups rather than sells .. even though the short-term structure looks messy.
There are three main buy zones I’m watching:
88,350
86,685
83,910
The second and third zones (86,685 and 83,910) are especially attractive because they sit deeper in the range .. meaning the reward-to-risk becomes heavily favorable if price bounces there.
But 88,350 also shouldn’t be ignored. Price could easily retest that level and rally straight from there. It’s a legitimate buy area as long as you keep a proper stop-loss.
If you want to be even more conservative, wait for the 15-minute structure to develop a bit more. The current small S1/S2 sequence on the far right looks a little compressed, and it may need more formation before a clean upward leg.
If price breaks below 83,910, step aside. Let it form a new structure.
Right now, trading within the range gives the most advantage: buy near the lower boundary and take profit near the top of the box around 94,160.
Another thing to note is the Up-Trendline. A trendline is just a guiding framework .. if it breaks, the probability of a continued move upward decreases, but it doesn’t drop to zero. It only becomes zero once price breaks below the key zone I mentioned earlier (83,910). If that level fails, I’ll step aside and wait, because sometimes it can still turn out to be a false break.
That’s the outlook for now.
Thanks to everyone who commented and showed support. I’ll keep updating the chart as things unfold.
Note
heres the update.
Disclaimer
The information and publications are not meant to be, and do not constitute, financial, investment, trading, or other types of advice or recommendations supplied or endorsed by TradingView. Read more in the Terms of Use.
Disclaimer
The information and publications are not meant to be, and do not constitute, financial, investment, trading, or other types of advice or recommendations supplied or endorsed by TradingView. Read more in the Terms of Use.