BTC Plan Analysis
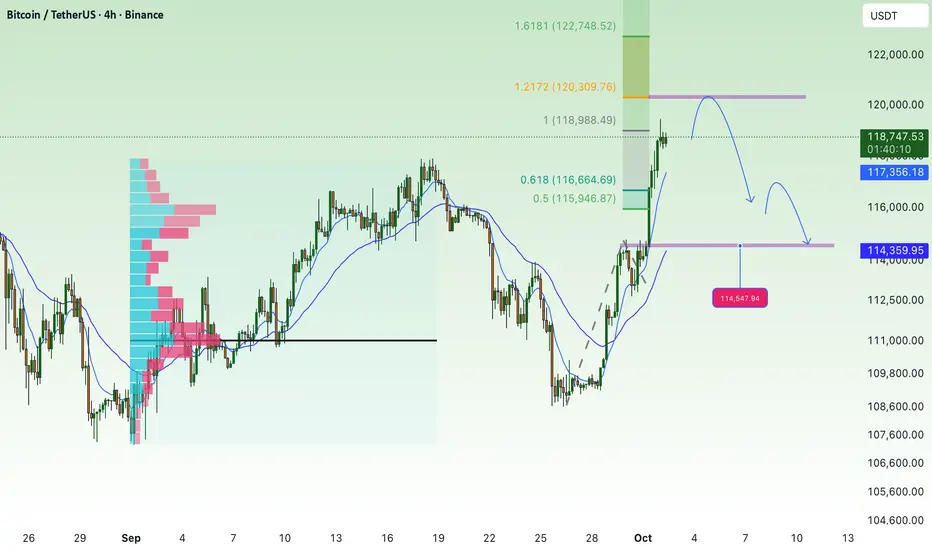
Currently, BTC has rallied strongly toward the 118,700 – 118,800 zone and is testing the 1.0 Fibonacci resistance. This area may trigger short-term profit-taking.
Main outlook: After a sharp rally, the market is likely to see a corrective move.
Key Levels
Resistance:
118,800 – 119,000 (near-term resistance, currently being tested)
120,428 (strong resistance on the higher timeframe)
122,500 (major resistance, extended wave target)
Support:
116,485 (Fibo 0.786, important confluence support)
114,837 (previous resistance turned support + EMA200)
114,150 – 114,050 (lower support, Fibo 0.236)
Possible Scenarios
BTC may face selling pressure at 118,800 – 119,000, leading to a correction back to 116,500.
If 116,500 breaks, the next support zone is 114,800 – 114,000.
If BTC holds above 116,500 and bounces, the market will likely retest the higher resistance at 120,400 – 122,500.
👉 Summary: Price is currently at short-term resistance. It’s better to wait for a reaction before making decisions. The correction toward 116.5K remains the primary scenario before the next clear move.
Dear My Friends,
NOVA returns and updates new information
✅ Gold Scalping Signal: 4 - 6 signals.
✅ Forex Signal: 5 - 8 signals.
✅ Trading Idea / Setup / Technical.
✅ NEW UPDATE : Signals free in Telegram:
t.me/+1mFSljRaI5RlNjg1
NOVA returns and updates new information
✅ Gold Scalping Signal: 4 - 6 signals.
✅ Forex Signal: 5 - 8 signals.
✅ Trading Idea / Setup / Technical.
✅ NEW UPDATE : Signals free in Telegram:
t.me/+1mFSljRaI5RlNjg1
Related publications
Disclaimer
The information and publications are not meant to be, and do not constitute, financial, investment, trading, or other types of advice or recommendations supplied or endorsed by TradingView. Read more in the Terms of Use.