Overview
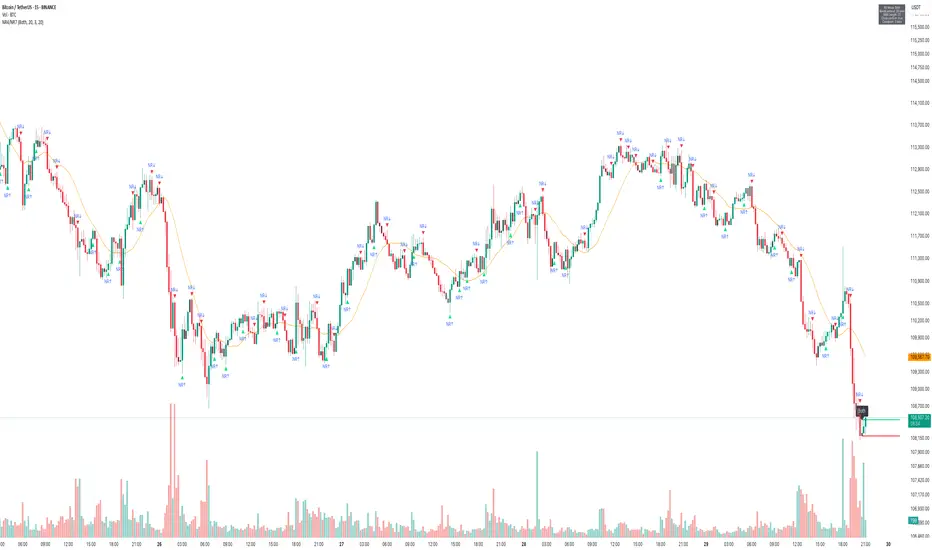
The NR4/NR7 Volatility Squeeze & Breakouts indicator highlights narrow range bars (the tightest candles in the last 4 or 7 bars).
These patterns often signal price contraction before an expansion move.
Performance Snapshot from the Chart
• Multiple NR4/NR7 labels appeared during sideways phases, correctly highlighting compression zones.
• Breakouts above/below the marked levels often triggered short directional bursts.
• The final cluster near the right edge (orange NR bar) preceded a sharp downside breakout, confirmed by both price and volume.
• The 20-period SMA acted as a bias filter:
• Breakouts below the SMA during the downtrend aligned with stronger moves.
• Breakouts against the SMA were generally weaker or faded quickly.
Key Observations
1. Clustering of NR Bars:
• When NR4/NR7 patterns cluster together, it often signals that a bigger move is loading.
2. Breakout Triggers:
• The High/Low of the NR bar served as clean breakout reference levels.
3. Volume Confirmation:
• Strong moves (especially the last breakdown) came with spikes in volume, adding conviction.
How Traders Can Use This
• Identify Volatility Contraction: Spot NR4/NR7 bars as potential setups.
• Set Levels: Use NR High/Low for breakout triggers.
• Add Filters: Combine with trend (SMA), volume, or support/resistance for stronger conviction.
• Risk Management: Opposite side of the NR bar can serve as a logical stop level.
Thanks.
TradeTech Analysis
Telegram Channel - t.me/Tradetech2024
Youtube Channel - youtube.com/@TradeTechAnalysis
Website - tradetechanalysis.com/
Super Profile - superprofile.bio/tradetechanalysis
TradeTech Analysis
Telegram Channel - t.me/Tradetech2024
Youtube Channel - youtube.com/@TradeTechAnalysis
Website - tradetechanalysis.com/
Super Profile - superprofile.bio/tradetechanalysis
Disclaimer
The information and publications are not meant to be, and do not constitute, financial, investment, trading, or other types of advice or recommendations supplied or endorsed by TradingView. Read more in the Terms of Use.