BTC Technical Analysis (1D Chart)
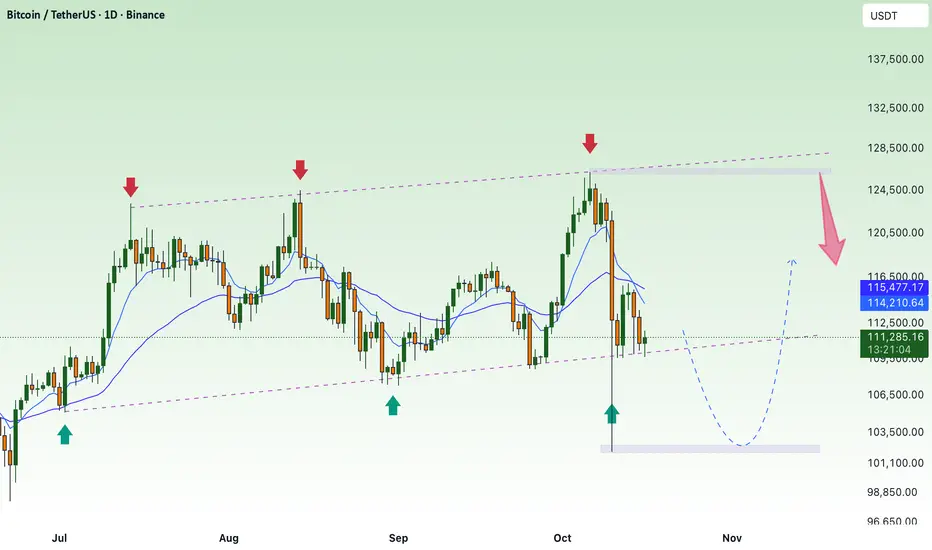
Bitcoin continues to move inside a rising channel, where the upper trendline has repeatedly acted as strong resistance (around $125,000–126,000), and the lower boundary has held as key support near $108,000.
After the recent rejection at the upper boundary, price has pulled back sharply and is now approaching the support zone at $108,000–108,500, which aligns with:
The bottom trendline of the ascending channel
The 200-day EMA (white line)
A previous reaction zone marked by strong bullish reversals in the past
If the support holds, BTC may see a technical rebound toward the EMA89–EMA34 zone around $114,000–115,000, or even back to the channel resistance near $125,000.
However, if price breaks below $108,000, it would confirm a bearish breakout from the channel, potentially opening the way toward $100,000–102,000.
Key Levels to Watch
Resistance: $114,000 – $115,800 / $125,000 – $126,000
Support: $108,000 – $108,500 (critical zone)
Trend: Neutral to bullish inside channel; bearish breakdown if $108K fails
Dear My Friends,
NOVA returns and updates new information
✅ Gold Scalping Signal: 4 - 6 signals.
✅ Forex Signal: 5 - 8 signals.
✅ Trading Idea / Setup / Technical.
✅ NEW UPDATE : Signals free in Telegram:
t.me/+1mFSljRaI5RlNjg1
NOVA returns and updates new information
✅ Gold Scalping Signal: 4 - 6 signals.
✅ Forex Signal: 5 - 8 signals.
✅ Trading Idea / Setup / Technical.
✅ NEW UPDATE : Signals free in Telegram:
t.me/+1mFSljRaI5RlNjg1
Related publications
Disclaimer
The information and publications are not meant to be, and do not constitute, financial, investment, trading, or other types of advice or recommendations supplied or endorsed by TradingView. Read more in the Terms of Use.