CAD/CHF Technical Analysis – Bullish Reversal from Key Support Zone 🟢📈
📅 Date: June 1, 2025
📊 Pair: CAD/CHF
🕰️ Timeframe: Daily (D1)
📌 Key Observations:
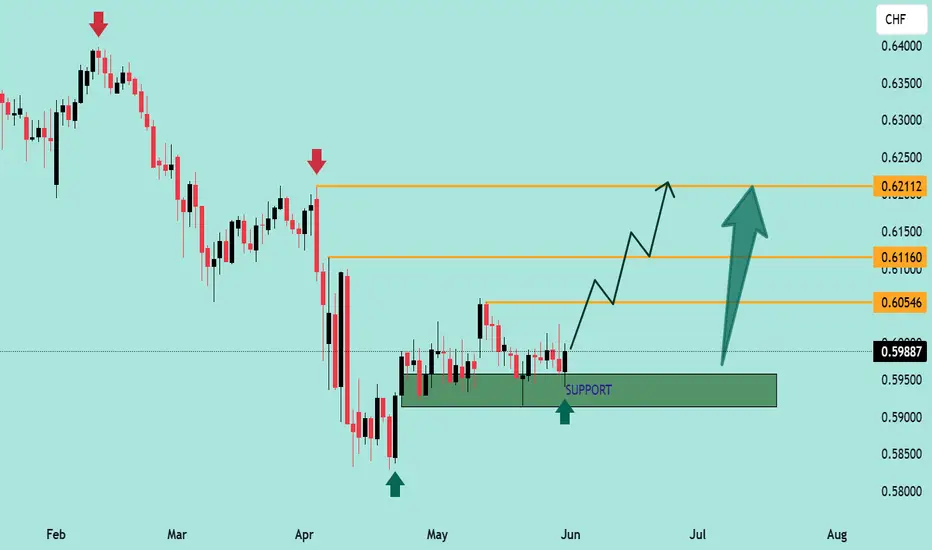
🟩 Strong Support Zone (0.5900 - 0.5950):
Price has consistently respected this demand zone since early May.
Multiple bullish rejections (green arrows) indicate strong buying interest.
📉 Previous Downtrend:
The market was in a clear bearish trend from February through April, forming lower highs and lower lows (red arrows mark swing highs).
🔁 Consolidation Phase:
Price has been ranging sideways for several weeks around the 0.5950 area, forming a base of accumulation.
📈 Bullish Scenario & Target Zones:
💥 A bullish breakout appears likely from the consolidation zone.
🚀 Upside Targets:
0.60546 – First minor resistance & potential take-profit level 🟠
0.61160 – Intermediate resistance and previous structural level 🟠
0.62112 – Major resistance and final bullish target for this swing 🟠
📈 Projection Path: The chart outlines a stair-step bullish structure with higher highs and higher lows, showing a probable path to 0.62112.
🧠 Conclusion:
CAD/CHF is showing signs of bullish reversal from a well-defined support zone. As long as price holds above 0.5950, we expect progressive upward movement toward the 0.6210 zone. Traders should monitor for bullish breakouts and potential confirmations with volume or candlestick patterns. 🔍📊
📌 Risk Management Tip:
Always use stop-loss below the support zone (~0.5900) and adjust positions as targets are reached.
📅 Date: June 1, 2025
📊 Pair: CAD/CHF
🕰️ Timeframe: Daily (D1)
📌 Key Observations:
🟩 Strong Support Zone (0.5900 - 0.5950):
Price has consistently respected this demand zone since early May.
Multiple bullish rejections (green arrows) indicate strong buying interest.
📉 Previous Downtrend:
The market was in a clear bearish trend from February through April, forming lower highs and lower lows (red arrows mark swing highs).
🔁 Consolidation Phase:
Price has been ranging sideways for several weeks around the 0.5950 area, forming a base of accumulation.
📈 Bullish Scenario & Target Zones:
💥 A bullish breakout appears likely from the consolidation zone.
🚀 Upside Targets:
0.60546 – First minor resistance & potential take-profit level 🟠
0.61160 – Intermediate resistance and previous structural level 🟠
0.62112 – Major resistance and final bullish target for this swing 🟠
📈 Projection Path: The chart outlines a stair-step bullish structure with higher highs and higher lows, showing a probable path to 0.62112.
🧠 Conclusion:
CAD/CHF is showing signs of bullish reversal from a well-defined support zone. As long as price holds above 0.5950, we expect progressive upward movement toward the 0.6210 zone. Traders should monitor for bullish breakouts and potential confirmations with volume or candlestick patterns. 🔍📊
📌 Risk Management Tip:
Always use stop-loss below the support zone (~0.5900) and adjust positions as targets are reached.
JOIN MY TELEGRAM CHANNEL
t.me/StellarMarketAnalysis
JOIN MY RECOMMENTED BROKER REFFREL LINK
⤵️one.exnesstrack.net/a/uvd1etcgg1
PARTNER CODE⤵️
uvd1etcgg1
t.me/StellarMarketAnalysis
JOIN MY RECOMMENTED BROKER REFFREL LINK
⤵️one.exnesstrack.net/a/uvd1etcgg1
PARTNER CODE⤵️
uvd1etcgg1
Disclaimer
The information and publications are not meant to be, and do not constitute, financial, investment, trading, or other types of advice or recommendations supplied or endorsed by TradingView. Read more in the Terms of Use.