Midterm forecast:
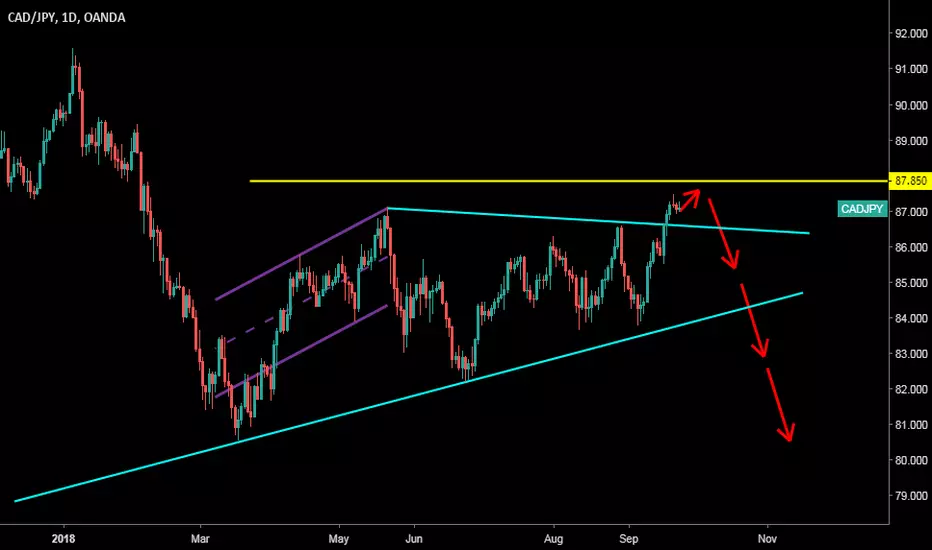
There is no trend in the market and the price is in a range bound, but we forecast a downtrend wave below 87.35 would begin in Midterm.
Technical analysis:
While the RSI uptrend #1 is not broken, bullish wave in price would continue.
A trough is formed in daily chart at 83.75 on 09/06/2018, so more gains to resistance(s) 86.20, 86.75 and maximum to Major Resistance (87.35) is expected.
Price is above WEMA21, if price drops more, this line can act as dynamic support against more losses.
Relative strength index (RSI) is 58.
algorithmic trader - I have quantified sentiment necessary for trading elliott waves
Disclaimer
The information and publications are not meant to be, and do not constitute, financial, investment, trading, or other types of advice or recommendations supplied or endorsed by TradingView. Read more in the Terms of Use.