GBPUSD: Potential Pullback Trade Explained 🇬🇧🇺🇸
GBPUSD closed this week, respecting a key daily horizontal support cluster.
Analyzing the intraday price action, I spotted a nice double bottom pattern
on an hourly time frame.
To buy the pair with a confirmation after the market opening,
I suggest waiting for a bullish breakout of its neckline.
An hourly candle close above will confirm a violation.
A bullish move will be expected at least to 1.296 level then.
❤️Please, support my work with like, thank you!❤️
I am part of Trade Nation's Influencer program and receive a monthly fee for using their TradingView charts in my analysis.
Forexsignals

XAU/USD: First Long,Then SHORT! (READ THE CAPTION)By examining the gold chart on the 15-minute timeframe, we can see that the price is currently trading around $3122, and I expect the price to soon reach higher levels such as $3128, $3133, $3135, and $3143, and after reaching each of these important levels, we will probably see an initial negative reaction!
Ultimately, I expect a strong rejection from the price once gold reaches $3144!
The level of this analysis is very high, so make sure to study it carefully!
Don’t forget to support this analysis!
Please support me with your likes and comments to motivate me to share more analysis with you and share your opinion about the possible trend of this chart with me !
Best Regards , Arman Shaban

EURUSD: Support & Resistance Analysis for Next Week 🇪🇺🇺🇸
Here is my latest structure analysis
and important supports and resistances for EURUSD for next week.
Consider these structures for pullback/breakout trading.
❤️Please, support my work with like, thank you!❤️
I am part of Trade Nation's Influencer program and receive a monthly fee for using their TradingView charts in my analysis.

XAUUSD sell Prices of Gold remain on the defensive on Thursday, hovering around the $3,100 region per troy ounce and retreating from earlier all-time peaks near the $3,170 level, all against the backdrop of investors' assessment of "Liberation Day".
XAUUSD sell signal 3112
Support 3101
Support 3088
Support 3064
Resistance 3136

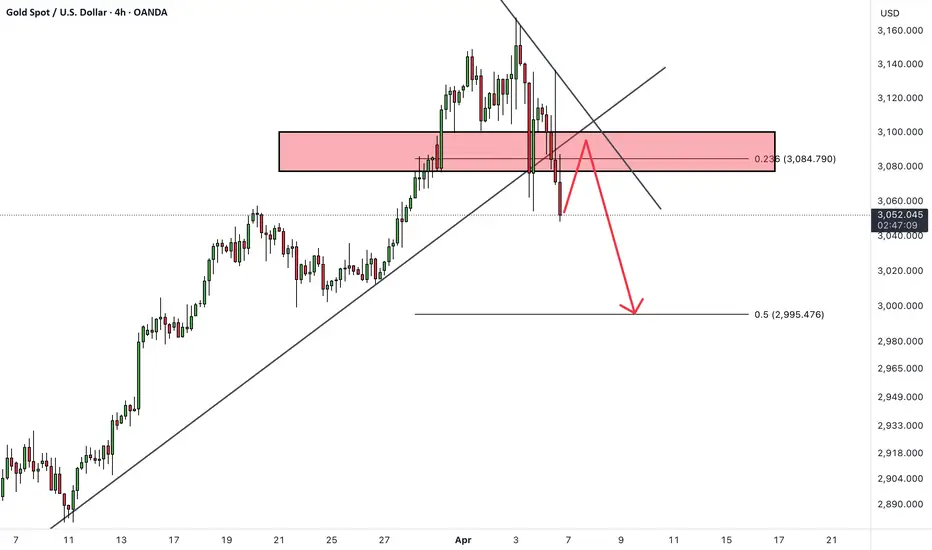
XAUUSDHello Traders!
What are your thoughts on GOLD?
Gold has broken its ascending trendline and failed to hold above the 3100 level.
We now expect a pullback to the broken trendline, which may act as resistance.
After the pullback, we anticipate a decline toward the specified support level.
Will gold continue its decline or regain bullish momentum? Share your thoughts below!
Don’t forget to like and share your thoughts in the comments! ❤️
#EURJPYWe've been holding strong around this level
If we hold here during London session, we'll definitely see a nice push on EURJPY
With a nice 1:3 RR
If you want to connect your account for 100% pure transparency, just send me a DM

EURAUD | H4 Market OutlookFUSIONMARKETS:EURAUD is approaching a buy area currently. It's a good opportunity to consider entering the market for potential gains.

AUD/USD : Bullish Momentum Builds from Strong DemandIn the 4-hour AUD/USD chart, strong supply and demand zones are visible. A significant demand zone is observed around the 0.62269 level. Within the chart, a Change of Character (ChoCh) is identified from the 0.6323 level, and a Break of Structure (BoS) is noted at the 0.63211 level. A strong selling reaction has been observed from the supply zone, and the market has retested that level again.
On the demand side, the market has touched the strong demand zone twice and showed a bullish formation each time. Currently, the price is forming a strong bullish candle again.
Based on the Fibonacci levels, potential upside targets could be seen at 0.62717, 0.63128, and 0.63312, provided the market holds above the demand zone. However, if the demand zone is broken, there is a possibility of the market dropping down to 0.61901 .

NFP BIG BULL SETUP BREAKOUT ALERT!🔥 Market Update for Traders! 🔥
Right now, the market is showing BEARISH momentum, and it's looking like we're heading for a dip. We could see the market fall and sweep the area around 3052 👀. Once that happens, expect a *huge* bounce back as the market could be getting ready to **shoot to the moon 🚀🌕!
🛑 KEY BUY LEVEL: 3130 - This is where you want to be ready to go long! 📈
🎯 First Target: Once we hit 3130, eyes on the ATH (All-Time High) for the retest! 🙌 And from there, we're eyeing a target at 3200 🚀🔥.
💥 NFP News Incoming! 💥
After Trump's speech, gold could *fall* around 1000 pips ⬇️, but **NFP could trigger a huge pump 📊💥. Stay sharp and trade with caution.
💡 Risk Management is KEY! Always follow your plan, set stop losses, and protect your capital. Don't let emotions drive your decisions! 📉🔑
Trade smart, stay sharp, and let's get those gains! 💸💥
#BearishMomentum #BullishReversal #RiskManagement #GoldPrice #NFPAlert

Pre-Market Analysis – CAD/CHF1️⃣ The price has broken below the previous support zone, which had held multiple times in the past. This area is now likely to act as a new resistance.
2️⃣ The bottom boundary of the descending channel has been touched, signaling a potential reaction or short-term bounce from this level.
3️⃣ It’s quite probable that the price retraces back to the midline of the channel before continuing its downward move. This would be a classic pullback within a bearish channel structure.
📉 If price fails to reclaim the broken support and reacts bearishly near the resistance-turned zone or the channel’s midline, it could provide a solid continuation setup to the downside.

XAU/USDFor this week, I've considered the weekly gold candle and selected round numbers as targets. I think gold will go up and trade within its usual range. What's your opinion, buddy?

EURGBPEURGBP Daily chart is in a correction phase. The price has come down to test the support zone again. If the price can stay above 0.82396, it is expected that the price will rebound. Consider buying the red zone.
🔥Trading futures, forex, CFDs and stocks carries a risk of loss.
Please consider carefully whether such trading is suitable for you.
>>GooD Luck 😊
❤️ Like and subscribe to never miss a new idea!

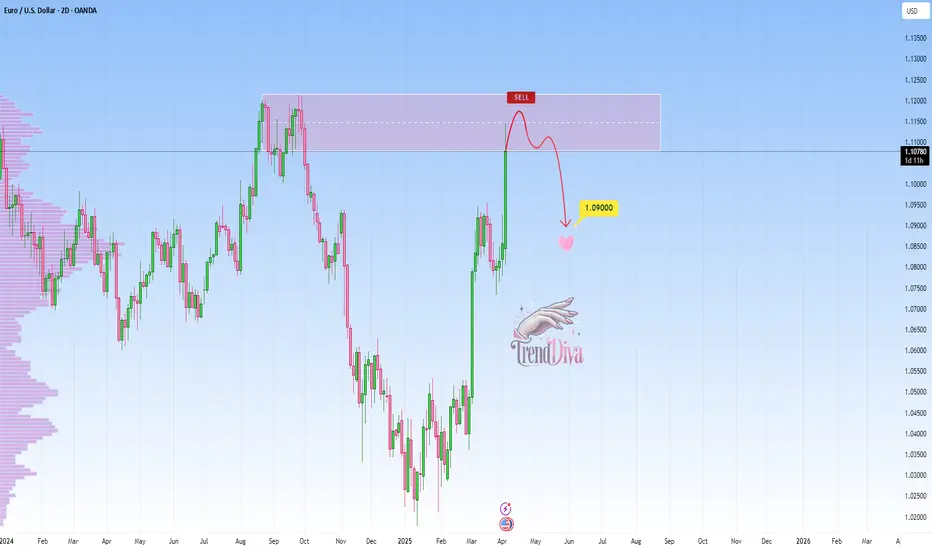
EURUSD at Major Resistance: Will it Drop To 1.09000?OANDA:EURUSD reached a major resistance level that has previously acted as a strong barrier, triggering bearish momentum in the past. This zone also aligns with prior supply areas where sellers have stepped in, making it a potential point of interest for those looking for short opportunities. Given its historical significance, how price reacts here could set the tone for the next move.
If bearish signals emerge, such as rejection wicks, bearish candlestick patterns, or signs of weakening bullish pressure, I anticipate a move toward the 1.09000 level. However, a clear breakout above this resistance could challenge the bearish outlook and open the door for further upside. It's a pivotal area where price action will likely provide clearer clues on the next direction.
Just my take on support and resistance zones, not financial advice. Always confirm your setups and trade with a proper risk management.
Best of luck!
GBPUSD Approaching Key Resistance - Will Sellers Step In?OANDA:GBPUSD is approaching a key resistance level, marked by significant selling pressure. This area has historically acted as a key supply zone, increasing the likelihood of a bearish reaction if sellers step in again.
The current market structure suggests that if the price confirms a rejection from this resistance level, there is a high probability of a downward move. I anticipate that if rejection occurs, the market may head lower toward the 1.30950 level, which serves as a logical target within the current market structure. However, a break above this resistance would invalidate the bearish bias and could lead to further upside.
This setup reflects the potential for a retracement after an impulsive move, supported by the confluence of previous price behavior and the current structure. If you agree with this analysis or have additional insights, feel free to share your thoughts in the comments!

USDCHF Approaching Major Support - Potential Reversal?OANDA:USDCHF is approaching a key support zone, marked by strong buying pressure. This area has historically served as a demand zone, suggesting the potential for a bullish reversal if buyers step in.
The current market structure indicates that if the price confirms a rejection from this support zone, there is a high probability of an upward move.
I anticipate that if buyers defend this level, the market may head higher toward the 0.87100 target, which represents a logical target within the current market structure. However, a break below this support would invalidate the bullish bias and could lead to further declines.
If you have any thoughts on this setup or see an alternative perspective, feel free to comment!

EURUSD road map !!!The Euro will increase two cents and reach to the top of the wedge in the coming weeks.
Give me some energy !!
✨We spend hours finding potential opportunities and writing useful ideas, we would be happy if you support us.
Best regards CobraVanguard.💚
_ _ _ _ __ _ _ _ _ _ _ _ _ _ _ _ _ _ _ _ _ _ _ _ _ _ _ _ _ _ _ _
✅Thank you, and for more ideas, hit ❤️Like❤️ and 🌟Follow🌟!
⚠️Things can change...
The markets are always changing and even with all these signals, the market changes tend to be strong and fast!!

Hellena | GOLD (4H): SHORT to 38.2% Fibo lvl 3050.Dear colleagues, the price has been in an upward movement for quite a long time and I believe .that it is time for a correction in the “2” wave.
I think it is possible that there may be a small update of the maximum of the top of wave “1” to 3176.771, then I expect a correction to the area of 38.2% Fibonacci level 3050.
As usual there are 2 possible entry options:
1) Market entry
2) Entry by pending limit orders, if the price updates the maximum.
Manage your capital correctly and competently! Only enter trades based on reliable patterns!

Falling towards 61.8% Fibonacci support?THE Cable (GBP/USD) is falling towards the pivot which has been identified as a pullback support and could bounce to the 1st resistance which is a pullback resistance.
Pivot: 1.3010
1st Support: 1.2881
1st Resistance: 1.3207
Risk Warning:
Trading Forex and CFDs carries a high level of risk to your capital and you should only trade with money you can afford to lose. Trading Forex and CFDs may not be suitable for all investors, so please ensure that you fully understand the risks involved and seek independent advice if necessary.
Disclaimer:
The above opinions given constitute general market commentary, and do not constitute the opinion or advice of IC Markets or any form of personal or investment advice.
Any opinions, news, research, analyses, prices, other information, or links to third-party sites contained on this website are provided on an "as-is" basis, are intended only to be informative, is not an advice nor a recommendation, nor research, or a record of our trading prices, or an offer of, or solicitation for a transaction in any financial instrument and thus should not be treated as such. The information provided does not involve any specific investment objectives, financial situation and needs of any specific person who may receive it. Please be aware, that past performance is not a reliable indicator of future performance and/or results. Past Performance or Forward-looking scenarios based upon the reasonable beliefs of the third-party provider are not a guarantee of future performance. Actual results may differ materially from those anticipated in forward-looking or past performance statements. IC Markets makes no representation or warranty and assumes no liability as to the accuracy or completeness of the information provided, nor any loss arising from any investment based on a recommendation, forecast or any information supplied by any third-party.

Bullish bounce?The Fiber (EUR/USD) is falling towards the pivot which lines up with the 50% Fibonacci retracement and could bounce to the 1st resistance.
Pivot: 1.0946
1st Support: 1.0836
1st Resistance: 1.1144
Risk Warning:
Trading Forex and CFDs carries a high level of risk to your capital and you should only trade with money you can afford to lose. Trading Forex and CFDs may not be suitable for all investors, so please ensure that you fully understand the risks involved and seek independent advice if necessary.
Disclaimer:
The above opinions given constitute general market commentary, and do not constitute the opinion or advice of IC Markets or any form of personal or investment advice.
Any opinions, news, research, analyses, prices, other information, or links to third-party sites contained on this website are provided on an "as-is" basis, are intended only to be informative, is not an advice nor a recommendation, nor research, or a record of our trading prices, or an offer of, or solicitation for a transaction in any financial instrument and thus should not be treated as such. The information provided does not involve any specific investment objectives, financial situation and needs of any specific person who may receive it. Please be aware, that past performance is not a reliable indicator of future performance and/or results. Past Performance or Forward-looking scenarios based upon the reasonable beliefs of the third-party provider are not a guarantee of future performance. Actual results may differ materially from those anticipated in forward-looking or past performance statements. IC Markets makes no representation or warranty and assumes no liability as to the accuracy or completeness of the information provided, nor any loss arising from any investment based on a recommendation, forecast or any information supplied by any third-party.

Could the price bounce from here?The Swissie (USD/CHF) is falling towards the pivot and could bounce to the 1st resistance.
Pivot: 0.8507
1st Support: 0.8390
1st Resistance: 0.8727
Risk Warning:
Trading Forex and CFDs carries a high level of risk to your capital and you should only trade with money you can afford to lose. Trading Forex and CFDs may not be suitable for all investors, so please ensure that you fully understand the risks involved and seek independent advice if necessary.
Disclaimer:
The above opinions given constitute general market commentary, and do not constitute the opinion or advice of IC Markets or any form of personal or investment advice.
Any opinions, news, research, analyses, prices, other information, or links to third-party sites contained on this website are provided on an "as-is" basis, are intended only to be informative, is not an advice nor a recommendation, nor research, or a record of our trading prices, or an offer of, or solicitation for a transaction in any financial instrument and thus should not be treated as such. The information provided does not involve any specific investment objectives, financial situation and needs of any specific person who may receive it. Please be aware, that past performance is not a reliable indicator of future performance and/or results. Past Performance or Forward-looking scenarios based upon the reasonable beliefs of the third-party provider are not a guarantee of future performance. Actual results may differ materially from those anticipated in forward-looking or past performance statements. IC Markets makes no representation or warranty and assumes no liability as to the accuracy or completeness of the information provided, nor any loss arising from any investment based on a recommendation, forecast or any information supplied by any third-party.

GBPCAD LONGS! GBPCAD LONGS
(PLEASE WATCH THE FULL VIDEO!)
* gbocad is extremely bullish and NFP is tomorrow
* Price is making higher highs and higher lows

Falling towards Fibo confluence?USD/JPY is falling towards the pivot which is a pullback support and could bounce tot he 1st resistance.
Pivot: 143.94
1st Support: 142.19
1st Resistance: 147.13
Risk Warning:
Trading Forex and CFDs carries a high level of risk to your capital and you should only trade with money you can afford to lose. Trading Forex and CFDs may not be suitable for all investors, so please ensure that you fully understand the risks involved and seek independent advice if necessary.
Disclaimer:
The above opinions given constitute general market commentary, and do not constitute the opinion or advice of IC Markets or any form of personal or investment advice.
Any opinions, news, research, analyses, prices, other information, or links to third-party sites contained on this website are provided on an "as-is" basis, are intended only to be informative, is not an advice nor a recommendation, nor research, or a record of our trading prices, or an offer of, or solicitation for a transaction in any financial instrument and thus should not be treated as such. The information provided does not involve any specific investment objectives, financial situation and needs of any specific person who may receive it. Please be aware, that past performance is not a reliable indicator of future performance and/or results. Past Performance or Forward-looking scenarios based upon the reasonable beliefs of the third-party provider are not a guarantee of future performance. Actual results may differ materially from those anticipated in forward-looking or past performance statements. IC Markets makes no representation or warranty and assumes no liability as to the accuracy or completeness of the information provided, nor any loss arising from any investment based on a recommendation, forecast or any information supplied by any third-party.

Bearish drop off pullback resistance?The Loonie (USD/CAD) is rising towards the pivot and could revrse to the 1st support which acts as an overlap support.
Pivot: 1.4155
1st Support: 1.3946
1st Resistance: 1.4309
Risk Warning:
Trading Forex and CFDs carries a high level of risk to your capital and you should only trade with money you can afford to lose. Trading Forex and CFDs may not be suitable for all investors, so please ensure that you fully understand the risks involved and seek independent advice if necessary.
Disclaimer:
The above opinions given constitute general market commentary, and do not constitute the opinion or advice of IC Markets or any form of personal or investment advice.
Any opinions, news, research, analyses, prices, other information, or links to third-party sites contained on this website are provided on an "as-is" basis, are intended only to be informative, is not an advice nor a recommendation, nor research, or a record of our trading prices, or an offer of, or solicitation for a transaction in any financial instrument and thus should not be treated as such. The information provided does not involve any specific investment objectives, financial situation and needs of any specific person who may receive it. Please be aware, that past performance is not a reliable indicator of future performance and/or results. Past Performance or Forward-looking scenarios based upon the reasonable beliefs of the third-party provider are not a guarantee of future performance. Actual results may differ materially from those anticipated in forward-looking or past performance statements. IC Markets makes no representation or warranty and assumes no liability as to the accuracy or completeness of the information provided, nor any loss arising from any investment based on a recommendation, forecast or any information supplied by any third-party.

GBPJPYHello Traders! 👋
What are your thoughts on GBPJPY?
On the daily chart of GBPJPY, a Rising Wedge pattern has formed. After a bullish move, the price has entered a resistance zone.
If the wedge breaks down and price confirms below the 192.000 level, a short position could offer a favorable risk-to-reward setup.
Don’t forget to like and share your thoughts in the comments! ❤️
