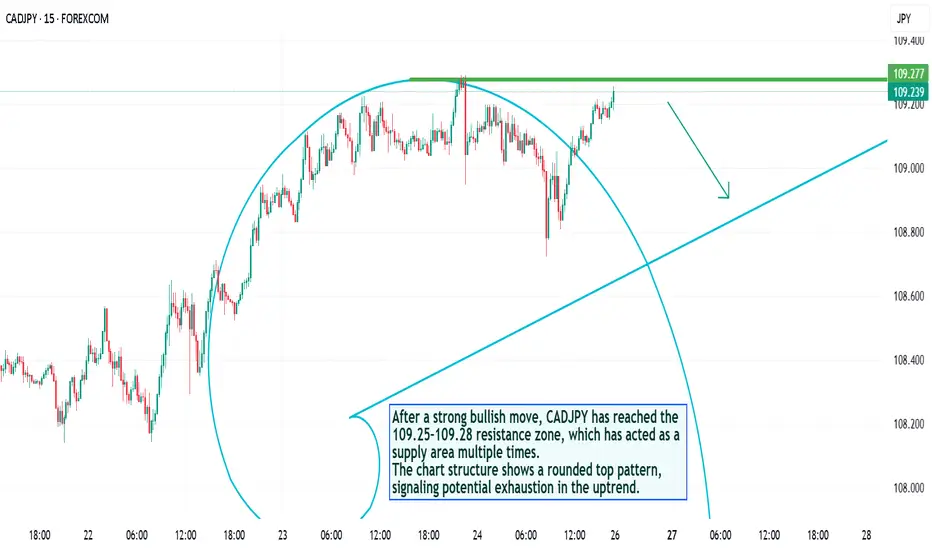
After a strong bullish move, CADJPY has reached the 109.25–109.28 resistance zone, which has acted as a supply area multiple times.
The chart structure shows a rounded top pattern, signaling potential exhaustion in the uptrend.
💡 Technical View:
Price repeatedly rejected from 109.27 zone.
Rounded top indicates weakening buying momentum.
A descending curve formation suggests upcoming bearish correction.
Rising trendline below (around 108.80–108.60) could be the next target zone.
📉 Trade Setup (Signal):
Entry (Sell): below 109.20
Stop Loss: 109.35
Take Profit 1: 108.90
Take Profit 2: 108.60
🧭 Bias: Short-term bearish
💬 Expecting price to turn down after testing resistance. If the pair breaks above 109.35 with volume, bearish view becomes invalid.
Disclaimer
The information and publications are not meant to be, and do not constitute, financial, investment, trading, or other types of advice or recommendations supplied or endorsed by TradingView. Read more in the Terms of Use.
Disclaimer
The information and publications are not meant to be, and do not constitute, financial, investment, trading, or other types of advice or recommendations supplied or endorsed by TradingView. Read more in the Terms of Use.