Central Depository Services Ltd – Compression Near Resistance After Shakeout
 CDSL
CDSL
📈 Pattern & Setup:
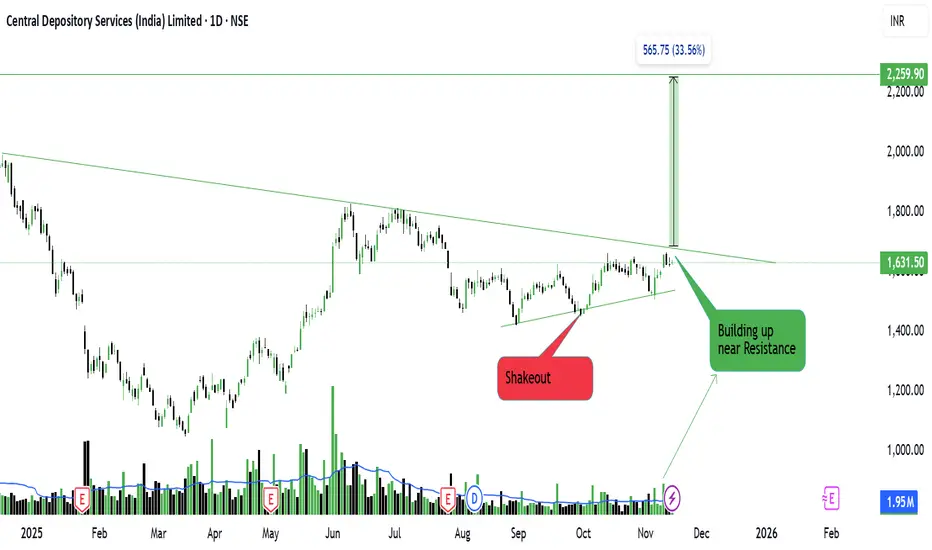
CDSL is showing a **beautiful post-shakeout structure** and currently building tight near its descending trendline resistance. After a deep shakeout in September, the stock quickly recovered, reclaiming lost ground and maintaining higher lows — a clear sign of demand returning.
The price is now **compressing between two converging trendlines**, forming a tight range just below breakout level around 1650. Volumes are drying up as it nears resistance, which is typical before a breakout expansion.
If the stock sustains above 1660–1680 with strong volume, it can ignite a fast move toward 2250+, supported by the pattern projection of around 33%.
📝 Trade Plan:
✍Entry: Above 1680 (breakout confirmation)
🚩Stop-Loss: 1550 (below recent higher low)
🎯Targets:
Target 1 → 1950
Target 2 → 2250
💡 Pyramiding Strategy:
1. Enter 60% position on breakout above 1680
2. Add 40% above 1750 after volume expansion
3. Trail stop-loss to 1600 once price sustains above 1850
🧠 Logic Behind the Setup:
This setup represents a **3T VCP (volatility contraction pattern)** emerging after a liquidity sweep. The shakeout cleared weak hands, and the tight price action near resistance indicates controlled absorption.
Once it breaks, the structure could turn into a **multi-week trend continuation**, given the higher timeframe alignment and volume behavior.
Keep Learning. Keep Earning.
Let’s grow together 📚🎯
🔴Disclaimer:
This analysis is for educational purposes only. Not a buy/sell recommendation. Please do your own research or consult your financial advisor before trading.
📈 Pattern & Setup:
CDSL is showing a **beautiful post-shakeout structure** and currently building tight near its descending trendline resistance. After a deep shakeout in September, the stock quickly recovered, reclaiming lost ground and maintaining higher lows — a clear sign of demand returning.
The price is now **compressing between two converging trendlines**, forming a tight range just below breakout level around 1650. Volumes are drying up as it nears resistance, which is typical before a breakout expansion.
If the stock sustains above 1660–1680 with strong volume, it can ignite a fast move toward 2250+, supported by the pattern projection of around 33%.
📝 Trade Plan:
✍Entry: Above 1680 (breakout confirmation)
🚩Stop-Loss: 1550 (below recent higher low)
🎯Targets:
Target 1 → 1950
Target 2 → 2250
💡 Pyramiding Strategy:
1. Enter 60% position on breakout above 1680
2. Add 40% above 1750 after volume expansion
3. Trail stop-loss to 1600 once price sustains above 1850
🧠 Logic Behind the Setup:
This setup represents a **3T VCP (volatility contraction pattern)** emerging after a liquidity sweep. The shakeout cleared weak hands, and the tight price action near resistance indicates controlled absorption.
Once it breaks, the structure could turn into a **multi-week trend continuation**, given the higher timeframe alignment and volume behavior.
Keep Learning. Keep Earning.
Let’s grow together 📚🎯
🔴Disclaimer:
This analysis is for educational purposes only. Not a buy/sell recommendation. Please do your own research or consult your financial advisor before trading.
TrendX INC
Disclaimer
The information and publications are not meant to be, and do not constitute, financial, investment, trading, or other types of advice or recommendations supplied or endorsed by TradingView. Read more in the Terms of Use.
TrendX INC
Disclaimer
The information and publications are not meant to be, and do not constitute, financial, investment, trading, or other types of advice or recommendations supplied or endorsed by TradingView. Read more in the Terms of Use.