Dear traders and followers,
welcome to todays Oil market analysis !
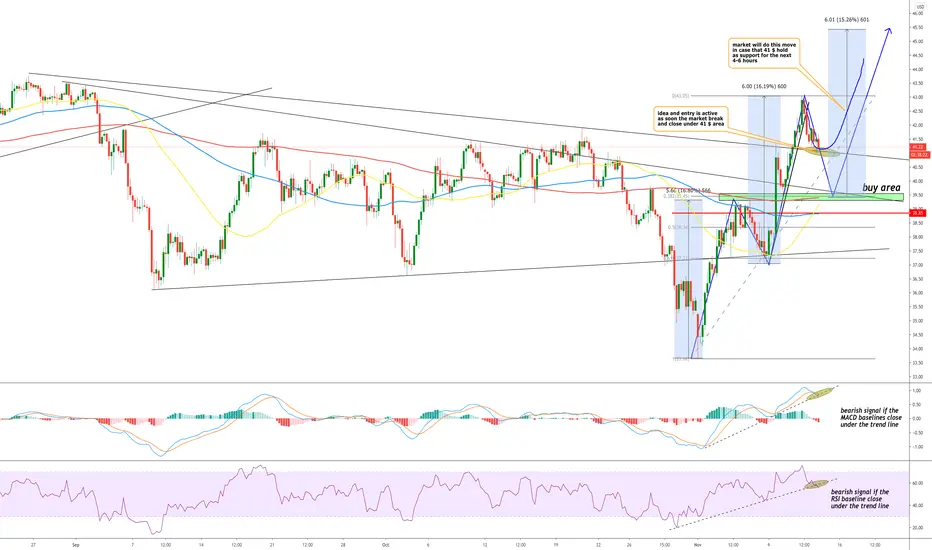
The WTI Oil price gained almost 30 % since beginning of November and seems to go into short term correction. On the weekly chart the market looks pretty bullish. We try to enter the market with a buy position at 39.30 - 39.50 $ area which is a good support area.
At this price area are several supports:
1. Fibonacci 38.2 retracement level
2. down trend line switched to support trend line
3. 50 day and 200 day moving average
Additional the MACD and RSI showing both short term bearish sell signals which support our short term correction analysis.
Feel free to leave a comment or to share your ideas in the comments section
Please hit the like button if you share or like this idea.
Follow us and stay up to date/ don't miss new ideas
Thanks for your support !
welcome to todays Oil market analysis !
The WTI Oil price gained almost 30 % since beginning of November and seems to go into short term correction. On the weekly chart the market looks pretty bullish. We try to enter the market with a buy position at 39.30 - 39.50 $ area which is a good support area.
At this price area are several supports:
1. Fibonacci 38.2 retracement level
2. down trend line switched to support trend line
3. 50 day and 200 day moving average
Additional the MACD and RSI showing both short term bearish sell signals which support our short term correction analysis.
Feel free to leave a comment or to share your ideas in the comments section
Please hit the like button if you share or like this idea.
Follow us and stay up to date/ don't miss new ideas
Thanks for your support !
Note
Market going to reach our analysed buy areaTrade closed: target reached
The analyses provided are for informational purposes only and do not constitute financial advice or recommendations to buy or sell anything. The information presented is based on personal research and interpretation.
Disclaimer
The information and publications are not meant to be, and do not constitute, financial, investment, trading, or other types of advice or recommendations supplied or endorsed by TradingView. Read more in the Terms of Use.