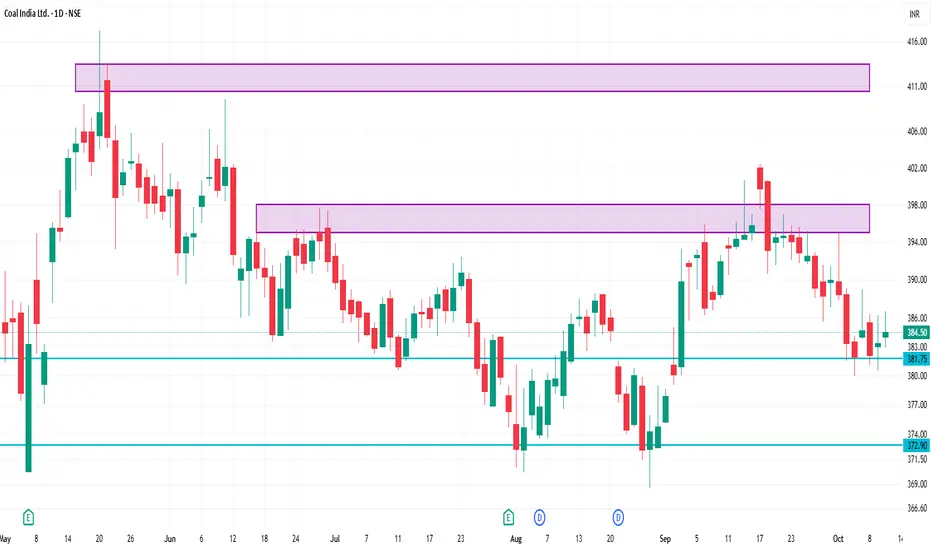
📊 Key Intraday Levels
Support Levels: ₹382.95 – ₹383.35
Resistance Levels: ₹386.70 – ₹387.85
Day Range: ₹382.95 – ₹386.70
Previous Close: ₹383.35
Upper Circuit Limit: ₹421.65
Lower Circuit Limit: ₹345.05
52-Week Range: ₹349.25 – ₹502.45
🔍 Technical Indicators
Pivot Points: Central Pivot at ₹389.17, with resistance at ₹391.20 and support at ₹388.55.
Candlestick Patterns: Recent sessions have shown patterns like Harami Bullish and Doji, indicating indecision and possible reversal attempts.
Relative Strength Index (RSI): The 14-day RSI is at 48.52, suggesting a neutral market condition.
📈 Summary
Coal India Ltd is currently trading near its support level of ₹383.35. A breakout above ₹387.85 could signal a bullish trend, while a decline below ₹382.95 may indicate a bearish move. Technical indicators suggest a neutral market condition, with recent candlestick patterns indicating indecision and possible reversal attempts.
Related publications
Disclaimer
The information and publications are not meant to be, and do not constitute, financial, investment, trading, or other types of advice or recommendations supplied or endorsed by TradingView. Read more in the Terms of Use.
Related publications
Disclaimer
The information and publications are not meant to be, and do not constitute, financial, investment, trading, or other types of advice or recommendations supplied or endorsed by TradingView. Read more in the Terms of Use.