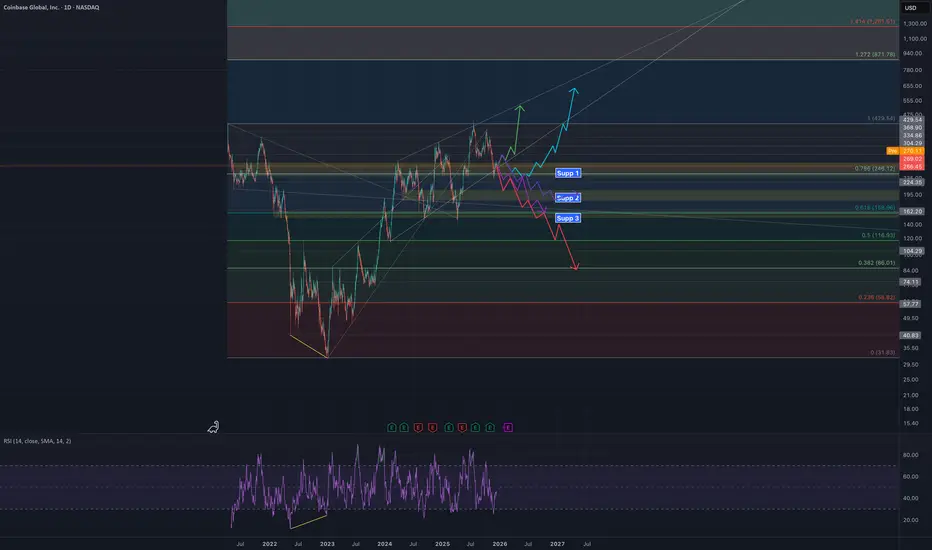
🚀 Continued Upside (The Most Optimistic Scenario)
Following the green arrow, the stock immediately recovers from the current level ($270.12) or the first minor support, breaks the current high (near $420.54), and rapidly advances toward the Fibonacci extension levels, targeting $877.76 (1.272 Fib) and potentially $1,000+ (1.414 Fib). This robust movement indicates strong buying pressure and a healthy bullish trend.
⬆️ Consolidation with Upside Breakout
Following the blue arrow, the stock pulls back to Support 1 (Supp 1), which aligns approximately with the $246.12 (0.786 Fib) level. This level acts as solid support, allowing the stock to consolidate and accumulate before resuming the uptrend and following the path toward higher highs.
🟡 Deep Retracement and Recovery
Following the purple arrow, the stock experiences a deeper correction, falling to Support 2 (Supp 2), which is near the $188.96 (0.618 Fib) level. A successful bounce here confirms the long-term bullish trend is intact, as the 0.618 Fibonacci level is a key point for a "healthy correction."
🔻 Major Correction with Last Effort
Following the top red arrow, the stock falls to Support 3 (Supp 3), coinciding with the $135.93 (0.5 Fib) level. A retracement to the 0.5 Fib is a substantial correction, representing the last chance for a bullish reversal if the stock holds above this key level and manages to bounce.
🔴 The Bearish Scenario (Trend Loss)
Following the bottom red arrow, the stock decisively breaks Support 3 ($135.93) and the 0.5 Fib level. This indicates a significant breakdown in market structure, confirming that the uptrend has ended. The next downside target would be the $86.01 (0.382 Fib) level and potentially a test of previous lows near $31.65 (0 Fib).
💡 Conclusion on Market Correlation
The correlation observed in highly volatile assets suggests that the specific path the stock chooses in the short term will be heavily influenced by the immediate reaction of the broader cryptocurrency market. A sharp rally in crypto could accelerate the stock toward the Upside Scenarios (1-3), whereas sustained weakness and a failure of key crypto supports could push this stock towards the more corrective Bearish Scenarios (4-5). Monitoring the short-term crypto sentiment is therefore key to validating the chosen path.
⚠️ Disclaimer: This analysis is based purely on technical chart patterns and is for informational purposes only. It does not constitute financial advice, investment recommendations, or an endorsement to buy or sell any security. Trading is inherently risky, and you should always conduct your own research and consult with a qualified financial professional before making any investment decisions.
Disclaimer
The information and publications are not meant to be, and do not constitute, financial, investment, trading, or other types of advice or recommendations supplied or endorsed by TradingView. Read more in the Terms of Use.
Disclaimer
The information and publications are not meant to be, and do not constitute, financial, investment, trading, or other types of advice or recommendations supplied or endorsed by TradingView. Read more in the Terms of Use.