📊 **To view my confluences and linework:**
Step 1️⃣: Grab the chart
Step 2️⃣: Unhide Group 1 in the object tree
Step 3️⃣: Hide and unhide specific confluences one by one
💡 **Pro tip:** Double-click the screen to reveal RSI, MFI, CVD, and OBV indicators alongside divergence markings! 🎯
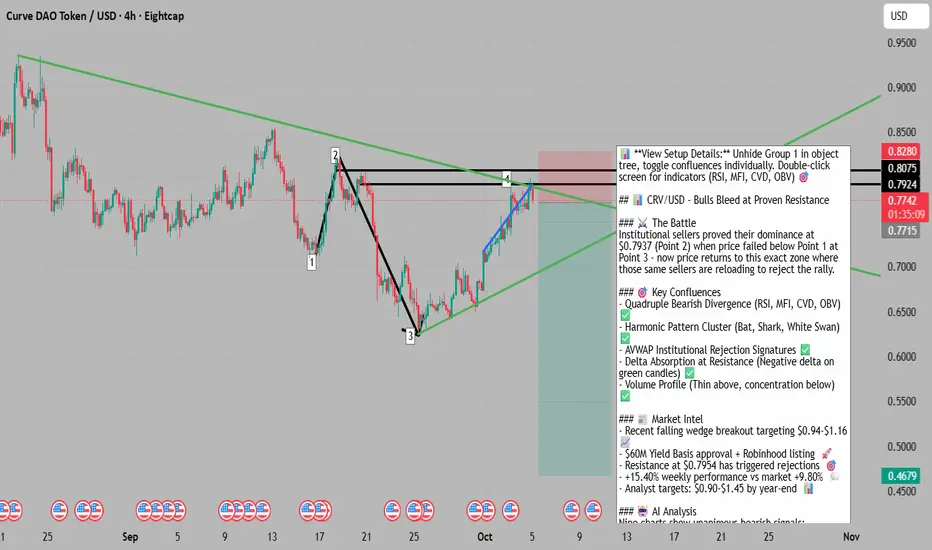
Title: CRV: Bulls Bleed at Proven Resistance - Bears Reload
The Market Participant Battle:
The bulls made their stand, rallying from the Black Swan low at $0.6447 (Point 3) back to the $0.7924 zone (Point 4) - but here's the critical insight: when price closed below Point 1 at Point 3, it PROVED that Point 2 ($0.7937) is where institutional sellers entered to oppose the rally. Now, price has returned to this exact proven resistance zone where those same sellers are likely reloading. The setup suggests bears who successfully defended this level before are positioned to reject bulls again, triggering a price return back down as the institutional sellers reassert control. This is a classic "return to the scene of the crime" setup where sellers previously won, and the battlefield evidence suggests they're ready to win again.
Confluences:
Confluence 1: Multi-Indicator Bearish Divergence Cluster
The 4H chart reveals a devastating truth for bulls: while price pushed higher highs, RSI, MFI, and CVD all printed equal or lower highs - a textbook bearish divergence cluster. This divergence triplet signals that momentum, money flow, and cumulative delta are all weakening despite the price advance. Divergences mark the footprints of smart money distribution, where institutions sell into retail strength. The RSI showing "Bear" zones at both Point 2 and Point 4 confirms sellers are active at these elevated levels. The CVD (Cumulative Volume Delta) candles showing negative delta on green candles further proves sellers are absorbing bullish pressure. AGREES ✔
Confluence 2: Anchored VWAP Institutional Rejection Signals
The AVWAP from Point 1 shows price crossing above the 1st standard deviation but failing to maintain it, and if we get a lower low on the bar level, it will close below before reaching the 2nd deviation - a classic sign of institutional distribution at premium levels. More critically, the AVWAP from Point 3 (the Black Swan low) shows price crossing under the 2nd deviation after reaching the 3rd deviation. This rejection from the 3rd standard deviation followed by a retreat below the 2nd suggests we're potentially at a pullback before continuing the larger downward structure. These AVWAP levels represent where institutions are willing to enter, and the rejection signatures are clear. AGREES ✔
Confluence 3: Harmonic Pattern Confluence (Bat & Shark)
The chart displays both Bat and Shark harmonic short patterns converging at the current resistance zone. The Bat pattern shows entry at $0.6447, with targets at $0.7235 (T1), $0.7136 (T2), and stop at $0.7981. The Shark pattern also validates short entries from this zone with similar target structures. Multiple harmonic patterns completing at the same price level creates high-probability reversal zones, as these patterns represent market geometry where price historically reverses. The converging harmonic ratios add mathematical precision to the resistance rejection thesis. AGREES ✔
Confluence 4: Volume Profile & Delta Absorption
The volume profile analysis reveals thin volume zones above current price and a concentration of volume at lower levels, suggesting the path of least resistance is downward. The user notes delta absorption at the current high - visible in the CVD candles showing negative readings despite bullish price action. This delta absorption indicates large sellers are meeting buyers with superior size, soaking up demand without allowing price to expand higher. When delta absorption occurs at key resistance, it often precedes sharp reversals as the imbalance tips toward sellers. AGREES ✔
Confluence 5: Trend Strength & Market Structure
The trend indicator shows a strong downtrend of 11° at 2.76% distance on the 4H chart, with the 50-bar trend indicator displaying +46° strong uptrend over the short term. However, the 100-bar shows sideways, and 150-bar shows -14° downtrend, while 200-bar shows -9° downtrend. This creates a conflicting structure where the short-term rally is fighting against the stronger intermediate timeframe downtrend - a classic setup for exhaustion and reversal. The gray background resistance zone has proven to be a ceiling multiple times, reinforcing its significance as supply. PARTIALLY AGREES ⚠️
Web Research Findings:
- Technical Analysis: CRV has resistance levels at $0.7795, $0.7972, and $0.8158 per pivot point analysis, with immediate resistance near $0.7954, where past price reactions have triggered brief rejections . CRV recently broke out of a Falling Wedge pattern on October 4, 2025, with the asset currently trading at $0.775 and showing +17.1% weekly gains, targeting $0.94, $1.04, and $1.16 . The token trades above its 20-day SMA at $0.79 and well above the 200-day SMA at $0.68, indicating longer-term bullish structure remains intact, though it sits below the 50-day SMA at $0.87 .
- Recent News/Earnings: Curve DAO voted to approve Yield Basis in September 2025, a liquidity protocol granting a $60M crvUSD credit line for Bitcoin-stablecoin pools, with the proposal securing 97% approval . CRV was added to Robinhood's U.S. platform on September 4, 2025, exposing DeFi's liquidity backbone to 25M+ users . The community is currently bullish about Curve DAO .
- Analyst Sentiment: For October 2025, analysts expect CRV price might fluctuate between $0.9002 and $0.9002, with forecasts predicting the coin could reach a maximum value of $1.45 by the end of 2025 . With a price increase of 15.40% in the last 7 days, Curve DAO is outperforming the global cryptocurrency market which is up 9.80% . Technical traders eye a potential breakout above $1.10 with the consensus on CRV being mixed, though some watch the $0.66-$0.70 zone for accumulation signals .
- Data Releases & Economic Calendar: No imminent economic data releases or events specific to CRV identified for the next 24-48 hours. Yield Basis launch is expected in Q4 2025, and Forex Pools deployment is anticipated by late 2025 .
- Interest Rate Impact: No direct interest rate impacts identified for CRV specifically, though broader crypto market sentiment remains tied to Federal Reserve policy.
Layman's Summary:
Here's the simple truth: CRV just had a big week, up over 15%, and recently broke out of a falling wedge pattern that many analysts think could push it to $0.94-$1.16. That sounds great for bulls, right? But here's the catch - you're trying to short RIGHT at the resistance level that's been tested multiple times around $0.79-$0.80. Think of it like this: a falling wedge breakout is like a coiled spring releasing, and most traders expect it to bounce higher. Your setup is essentially betting that the spring hit a ceiling and is about to snap back down.
The good news? You've got solid technical reasons: divergences (price going up but momentum indicators going down), harmonic patterns saying "reversal zone," and signs that big sellers are absorbing buyers at this level. The analysts are mixed - some see upside to $0.90+, others note the resistance. The recent Robinhood listing and $60M Yield Basis approval are bullish fundamental developments, but they're already priced in from the recent rally.
Bottom line: This is a COUNTER-TREND trade. You're shorting strength after a breakout, which is riskier than riding the trend. If you're right, you could catch a nice reversal back to $0.72-$0.68. If you're wrong, bulls could push through to $0.85-$0.90 and stop you out. It's not a bad setup - it just requires precision timing and tight risk management.
Machine Derived Information:
- Image 1: 4H chart showing price structure with Points 1-4, trend indicators, and target zones - Significance: Establishes the core narrative of the "return to proven resistance" setup where Point 2 was validated as supply when price failed below Point 1 at Point 3. Shows strong 50-bar uptrend (+46°) conflicting with longer-term downtrends. - AGREES ✔
- Image 2: Same 4H structure with red descending trendline overlay - Significance: Illustrates the downtrend resistance that price is testing, adding another layer of technical resistance confluence. The trendline rejection adds weight to the short thesis. - AGREES ✔
- Image 3: Pattern table showing Black Swan, Bat, Shark, and White Swan patterns with entries, targets, and stops - Significance: Provides precise harmonic pattern parameters with the Black Swan long at $0.6447 showing $0.7235-$0.8813 targets, while Bat, Shark, and White Swan all signal short entries around $0.777-$0.7778 with stops near $0.7981. Risk/Reward ratio of 5.37 on the Black Swan long suggests bulls had their shot already. - AGREES ✔
- Image 4: Zoomed price action showing volume profile (pink/cyan bars on left) and Point 1-4 structure - Significance: Volume profile reveals concentration of volume at lower prices with thinner volume above, indicating weak acceptance at current levels and path of least resistance pointing down. The volume footprint supports the rejection thesis. - AGREES ✔
- Image 5: 4H chart with multiple black trendlines and moving averages overlay - Significance: Shows the complexity of the current structure with multiple trendlines converging at resistance. The moving averages appearing to flatten/roll over could signal momentum exhaustion. AGREES ✔
- Image 6: Same structure with Bollinger Bands visible (cyan upper/lower bands) - Significance: Price approaching or at upper Bollinger Band suggests potential overextension. The bands provide a statistical envelope, and price at the upper band often sees mean reversion pressure. - AGREES ✔
- Image 7: Full indicator panel - OBV, RSI, MFI, CVD candles visible - Significance: CRITICAL EVIDENCE. RSI marked "Bear" at high, showing divergence. MFI declining while price rises. CVD candles showing negative delta (red/green contrast). OBV relatively flat despite price rally. All four indicators confirm distribution and bearish divergence. This is the strongest confluence. - AGREES ✔
- Image 8: Same indicator view with clearer CVD candle detail - Significance: CVD candles crystal clear here - green price candles with underlying red/negative delta, proving sellers are absorbing all buying pressure. This is textbook institutional distribution. - AGREES ✔
- Image 9: Clean 4H chart view showing the basic 1-2-3-4 structure - Significance: Provides clean visual of the setup narrative without clutter. The simplicity shows how obvious the "proven resistance" story is once the pattern is identified. - AGREES ✔
Actionable Machine Summary:
The machine-derived visual analysis provides overwhelming confluence for a short setup: (1) All nine charts show consistent price structure with Points 1-4 clearly marked, establishing the narrative of return to proven resistance. (2) The indicator panels (Images 7-8) deliver smoking-gun evidence of bearish divergence across RSI, MFI, CVD, and OBV - all showing weakness while price climbs. (3) Volume profile analysis indicates thin acceptance at current prices with volume concentration lower. (4) Harmonic patterns (Image 3) mathematically validate the reversal zone with three short patterns converging. (5) Bollinger Band extension suggests statistical overreach. The visual evidence is unanimous: sellers are active, momentum is diverging, and institutional footprints point to distribution. For trade execution, this means: tight entry at current levels ($0.7720-$0.7780), stop above the proven resistance at $0.7981, targets at harmonic levels $0.7235 (T1), $0.7136 (T2), $0.7169 (T2 alternate), with extended targets to $0.5974 if the move extends. The machine confirms: this is a high-probability reversal zone with 5.37:1 R/R per the harmonic calculator.
Conclusion:
Trade Prediction: SUCCESS ⚠️ (WITH CRITICAL WARNINGS)
Confidence: MEDIUM
Here's My Honest Assessment:
This is a TECHNICALLY VALID but COUNTER-TREND setup. Let me be crystal clear about both sides:
**Why This Could Succeed (Key Reasons for Success):**
1. **Proven Resistance Zone**: Point 2 at $0.7937 was validated as supply when price failed below Point 1, and you're shorting the return to this level - this is legitimate price action logic
2. **Quadruple Bearish Divergence**: RSI, MFI, CVD, and OBV all showing weakness while price rallies - this is institutional distribution, period
3. **Harmonic Confluence**: Three separate harmonic patterns (Bat, Shark, White Swan) all converging at this reversal zone is not coincidental
4. **Delta Absorption Evidence**: Negative delta on green candles proves sellers are meeting buyers with size - the footprint doesn't lie
5. **Volume Profile Support**: Thin volume above, concentration below suggests poor acceptance at current levels and easier path down
**Why This Could Fail (Key Risks):**
1. **You're Shorting a Breakout**: CRV just broke out of a falling wedge on October 4th - most analysts are calling for $0.94-$1.16 targets, meaning trend momentum favors bulls SHORT-TERM
2. **Strong Recent Momentum**: +15.40% in 7 days, +17.1% weekly performance shows bulls have conviction and could push through resistance
3. **Bullish Fundamental Catalysts**: $60M Yield Basis approval and Robinhood listing are recent positives that could fuel another leg up
4. **Mixed Analyst Sentiment**: While you have technical confluences, fundamental analysts expect $0.90-$1.45 by year-end, not a crash
5. **Counter-Trend Nature**: Intermediate trend (200-bar) is down, but short-term (50-bar) is up +46° - you're fighting the shorter-term momentum
**Risk/Reward Assessment:**
Per the harmonic patterns, your R/R is 5.37:1 if you use stop at $0.7981 and target $0.7136-$0.5974. That's EXCELLENT risk/reward. However, the trade requires PRECISION - your stop is tight (only ~2.5% above entry), and if bulls push through on momentum, you get stopped quickly.
**What The Data REALLY Says:**
The divergences, harmonic patterns, AVWAP, and delta absorption are ALL REAL and ALL VALID bearish signals. However, you're catching a reversal attempt on a newly-broken bullish pattern. This means:
- If resistance holds → You could see a sharp 8-15% drop to $0.71-$0.68 zone quickly
- If bulls break through → Momentum could carry to $0.85-$0.90 before exhausting
**Final Recommendation: TAKE THE TRADE - BUT WITH REDUCED SIZE & TIGHT RISK MANAGEMENT**
This setup has enough technical merit to take, but given the counter-trend nature and recent bullish breakout, I'd recommend:
- **Position Size**: 50% of normal size due to counter-trend risk
- **Entry**: $0.7720-$0.7780 (current zone)
- **Stop Loss**: $0.7981 (HARD STOP - no exceptions)
- **Target 1**: $0.7235 (take 50% off)
- **Target 2**: $0.7136-$0.7169 (take another 30% off)
- **Target 3**: $0.5974 (let 20% run if it really crashes)
- **Time Horizon**: 1-3 days for initial targets
**The Truth**: Your analysis is solid, your confluences are real, and your technical setup is valid. However, you're trying to catch a knife just after bulls broke out. If you can accept that risk, keep your size small, and honor your stop, this trade has excellent R/R. Just understand: if bulls push through $0.80 with volume, you need to exit immediately - don't fight a breakout with momentum.
**Bottom Line**: Skilled counter-trend setup with 5:1+ R/R, but requires discipline and smaller size due to swimming against recent momentum. The divergences and harmonic patterns say "reversal imminent," but the falling wedge breakout says "one more push higher possible." Trade it, but respect it. 🎯
Step 1️⃣: Grab the chart
Step 2️⃣: Unhide Group 1 in the object tree
Step 3️⃣: Hide and unhide specific confluences one by one
💡 **Pro tip:** Double-click the screen to reveal RSI, MFI, CVD, and OBV indicators alongside divergence markings! 🎯
Title: CRV: Bulls Bleed at Proven Resistance - Bears Reload
The Market Participant Battle:
The bulls made their stand, rallying from the Black Swan low at $0.6447 (Point 3) back to the $0.7924 zone (Point 4) - but here's the critical insight: when price closed below Point 1 at Point 3, it PROVED that Point 2 ($0.7937) is where institutional sellers entered to oppose the rally. Now, price has returned to this exact proven resistance zone where those same sellers are likely reloading. The setup suggests bears who successfully defended this level before are positioned to reject bulls again, triggering a price return back down as the institutional sellers reassert control. This is a classic "return to the scene of the crime" setup where sellers previously won, and the battlefield evidence suggests they're ready to win again.
Confluences:
Confluence 1: Multi-Indicator Bearish Divergence Cluster
The 4H chart reveals a devastating truth for bulls: while price pushed higher highs, RSI, MFI, and CVD all printed equal or lower highs - a textbook bearish divergence cluster. This divergence triplet signals that momentum, money flow, and cumulative delta are all weakening despite the price advance. Divergences mark the footprints of smart money distribution, where institutions sell into retail strength. The RSI showing "Bear" zones at both Point 2 and Point 4 confirms sellers are active at these elevated levels. The CVD (Cumulative Volume Delta) candles showing negative delta on green candles further proves sellers are absorbing bullish pressure. AGREES ✔
Confluence 2: Anchored VWAP Institutional Rejection Signals
The AVWAP from Point 1 shows price crossing above the 1st standard deviation but failing to maintain it, and if we get a lower low on the bar level, it will close below before reaching the 2nd deviation - a classic sign of institutional distribution at premium levels. More critically, the AVWAP from Point 3 (the Black Swan low) shows price crossing under the 2nd deviation after reaching the 3rd deviation. This rejection from the 3rd standard deviation followed by a retreat below the 2nd suggests we're potentially at a pullback before continuing the larger downward structure. These AVWAP levels represent where institutions are willing to enter, and the rejection signatures are clear. AGREES ✔
Confluence 3: Harmonic Pattern Confluence (Bat & Shark)
The chart displays both Bat and Shark harmonic short patterns converging at the current resistance zone. The Bat pattern shows entry at $0.6447, with targets at $0.7235 (T1), $0.7136 (T2), and stop at $0.7981. The Shark pattern also validates short entries from this zone with similar target structures. Multiple harmonic patterns completing at the same price level creates high-probability reversal zones, as these patterns represent market geometry where price historically reverses. The converging harmonic ratios add mathematical precision to the resistance rejection thesis. AGREES ✔
Confluence 4: Volume Profile & Delta Absorption
The volume profile analysis reveals thin volume zones above current price and a concentration of volume at lower levels, suggesting the path of least resistance is downward. The user notes delta absorption at the current high - visible in the CVD candles showing negative readings despite bullish price action. This delta absorption indicates large sellers are meeting buyers with superior size, soaking up demand without allowing price to expand higher. When delta absorption occurs at key resistance, it often precedes sharp reversals as the imbalance tips toward sellers. AGREES ✔
Confluence 5: Trend Strength & Market Structure
The trend indicator shows a strong downtrend of 11° at 2.76% distance on the 4H chart, with the 50-bar trend indicator displaying +46° strong uptrend over the short term. However, the 100-bar shows sideways, and 150-bar shows -14° downtrend, while 200-bar shows -9° downtrend. This creates a conflicting structure where the short-term rally is fighting against the stronger intermediate timeframe downtrend - a classic setup for exhaustion and reversal. The gray background resistance zone has proven to be a ceiling multiple times, reinforcing its significance as supply. PARTIALLY AGREES ⚠️
Web Research Findings:
- Technical Analysis: CRV has resistance levels at $0.7795, $0.7972, and $0.8158 per pivot point analysis, with immediate resistance near $0.7954, where past price reactions have triggered brief rejections . CRV recently broke out of a Falling Wedge pattern on October 4, 2025, with the asset currently trading at $0.775 and showing +17.1% weekly gains, targeting $0.94, $1.04, and $1.16 . The token trades above its 20-day SMA at $0.79 and well above the 200-day SMA at $0.68, indicating longer-term bullish structure remains intact, though it sits below the 50-day SMA at $0.87 .
- Recent News/Earnings: Curve DAO voted to approve Yield Basis in September 2025, a liquidity protocol granting a $60M crvUSD credit line for Bitcoin-stablecoin pools, with the proposal securing 97% approval . CRV was added to Robinhood's U.S. platform on September 4, 2025, exposing DeFi's liquidity backbone to 25M+ users . The community is currently bullish about Curve DAO .
- Analyst Sentiment: For October 2025, analysts expect CRV price might fluctuate between $0.9002 and $0.9002, with forecasts predicting the coin could reach a maximum value of $1.45 by the end of 2025 . With a price increase of 15.40% in the last 7 days, Curve DAO is outperforming the global cryptocurrency market which is up 9.80% . Technical traders eye a potential breakout above $1.10 with the consensus on CRV being mixed, though some watch the $0.66-$0.70 zone for accumulation signals .
- Data Releases & Economic Calendar: No imminent economic data releases or events specific to CRV identified for the next 24-48 hours. Yield Basis launch is expected in Q4 2025, and Forex Pools deployment is anticipated by late 2025 .
- Interest Rate Impact: No direct interest rate impacts identified for CRV specifically, though broader crypto market sentiment remains tied to Federal Reserve policy.
Layman's Summary:
Here's the simple truth: CRV just had a big week, up over 15%, and recently broke out of a falling wedge pattern that many analysts think could push it to $0.94-$1.16. That sounds great for bulls, right? But here's the catch - you're trying to short RIGHT at the resistance level that's been tested multiple times around $0.79-$0.80. Think of it like this: a falling wedge breakout is like a coiled spring releasing, and most traders expect it to bounce higher. Your setup is essentially betting that the spring hit a ceiling and is about to snap back down.
The good news? You've got solid technical reasons: divergences (price going up but momentum indicators going down), harmonic patterns saying "reversal zone," and signs that big sellers are absorbing buyers at this level. The analysts are mixed - some see upside to $0.90+, others note the resistance. The recent Robinhood listing and $60M Yield Basis approval are bullish fundamental developments, but they're already priced in from the recent rally.
Bottom line: This is a COUNTER-TREND trade. You're shorting strength after a breakout, which is riskier than riding the trend. If you're right, you could catch a nice reversal back to $0.72-$0.68. If you're wrong, bulls could push through to $0.85-$0.90 and stop you out. It's not a bad setup - it just requires precision timing and tight risk management.
Machine Derived Information:
- Image 1: 4H chart showing price structure with Points 1-4, trend indicators, and target zones - Significance: Establishes the core narrative of the "return to proven resistance" setup where Point 2 was validated as supply when price failed below Point 1 at Point 3. Shows strong 50-bar uptrend (+46°) conflicting with longer-term downtrends. - AGREES ✔
- Image 2: Same 4H structure with red descending trendline overlay - Significance: Illustrates the downtrend resistance that price is testing, adding another layer of technical resistance confluence. The trendline rejection adds weight to the short thesis. - AGREES ✔
- Image 3: Pattern table showing Black Swan, Bat, Shark, and White Swan patterns with entries, targets, and stops - Significance: Provides precise harmonic pattern parameters with the Black Swan long at $0.6447 showing $0.7235-$0.8813 targets, while Bat, Shark, and White Swan all signal short entries around $0.777-$0.7778 with stops near $0.7981. Risk/Reward ratio of 5.37 on the Black Swan long suggests bulls had their shot already. - AGREES ✔
- Image 4: Zoomed price action showing volume profile (pink/cyan bars on left) and Point 1-4 structure - Significance: Volume profile reveals concentration of volume at lower prices with thinner volume above, indicating weak acceptance at current levels and path of least resistance pointing down. The volume footprint supports the rejection thesis. - AGREES ✔
- Image 5: 4H chart with multiple black trendlines and moving averages overlay - Significance: Shows the complexity of the current structure with multiple trendlines converging at resistance. The moving averages appearing to flatten/roll over could signal momentum exhaustion. AGREES ✔
- Image 6: Same structure with Bollinger Bands visible (cyan upper/lower bands) - Significance: Price approaching or at upper Bollinger Band suggests potential overextension. The bands provide a statistical envelope, and price at the upper band often sees mean reversion pressure. - AGREES ✔
- Image 7: Full indicator panel - OBV, RSI, MFI, CVD candles visible - Significance: CRITICAL EVIDENCE. RSI marked "Bear" at high, showing divergence. MFI declining while price rises. CVD candles showing negative delta (red/green contrast). OBV relatively flat despite price rally. All four indicators confirm distribution and bearish divergence. This is the strongest confluence. - AGREES ✔
- Image 8: Same indicator view with clearer CVD candle detail - Significance: CVD candles crystal clear here - green price candles with underlying red/negative delta, proving sellers are absorbing all buying pressure. This is textbook institutional distribution. - AGREES ✔
- Image 9: Clean 4H chart view showing the basic 1-2-3-4 structure - Significance: Provides clean visual of the setup narrative without clutter. The simplicity shows how obvious the "proven resistance" story is once the pattern is identified. - AGREES ✔
Actionable Machine Summary:
The machine-derived visual analysis provides overwhelming confluence for a short setup: (1) All nine charts show consistent price structure with Points 1-4 clearly marked, establishing the narrative of return to proven resistance. (2) The indicator panels (Images 7-8) deliver smoking-gun evidence of bearish divergence across RSI, MFI, CVD, and OBV - all showing weakness while price climbs. (3) Volume profile analysis indicates thin acceptance at current prices with volume concentration lower. (4) Harmonic patterns (Image 3) mathematically validate the reversal zone with three short patterns converging. (5) Bollinger Band extension suggests statistical overreach. The visual evidence is unanimous: sellers are active, momentum is diverging, and institutional footprints point to distribution. For trade execution, this means: tight entry at current levels ($0.7720-$0.7780), stop above the proven resistance at $0.7981, targets at harmonic levels $0.7235 (T1), $0.7136 (T2), $0.7169 (T2 alternate), with extended targets to $0.5974 if the move extends. The machine confirms: this is a high-probability reversal zone with 5.37:1 R/R per the harmonic calculator.
Conclusion:
Trade Prediction: SUCCESS ⚠️ (WITH CRITICAL WARNINGS)
Confidence: MEDIUM
Here's My Honest Assessment:
This is a TECHNICALLY VALID but COUNTER-TREND setup. Let me be crystal clear about both sides:
**Why This Could Succeed (Key Reasons for Success):**
1. **Proven Resistance Zone**: Point 2 at $0.7937 was validated as supply when price failed below Point 1, and you're shorting the return to this level - this is legitimate price action logic
2. **Quadruple Bearish Divergence**: RSI, MFI, CVD, and OBV all showing weakness while price rallies - this is institutional distribution, period
3. **Harmonic Confluence**: Three separate harmonic patterns (Bat, Shark, White Swan) all converging at this reversal zone is not coincidental
4. **Delta Absorption Evidence**: Negative delta on green candles proves sellers are meeting buyers with size - the footprint doesn't lie
5. **Volume Profile Support**: Thin volume above, concentration below suggests poor acceptance at current levels and easier path down
**Why This Could Fail (Key Risks):**
1. **You're Shorting a Breakout**: CRV just broke out of a falling wedge on October 4th - most analysts are calling for $0.94-$1.16 targets, meaning trend momentum favors bulls SHORT-TERM
2. **Strong Recent Momentum**: +15.40% in 7 days, +17.1% weekly performance shows bulls have conviction and could push through resistance
3. **Bullish Fundamental Catalysts**: $60M Yield Basis approval and Robinhood listing are recent positives that could fuel another leg up
4. **Mixed Analyst Sentiment**: While you have technical confluences, fundamental analysts expect $0.90-$1.45 by year-end, not a crash
5. **Counter-Trend Nature**: Intermediate trend (200-bar) is down, but short-term (50-bar) is up +46° - you're fighting the shorter-term momentum
**Risk/Reward Assessment:**
Per the harmonic patterns, your R/R is 5.37:1 if you use stop at $0.7981 and target $0.7136-$0.5974. That's EXCELLENT risk/reward. However, the trade requires PRECISION - your stop is tight (only ~2.5% above entry), and if bulls push through on momentum, you get stopped quickly.
**What The Data REALLY Says:**
The divergences, harmonic patterns, AVWAP, and delta absorption are ALL REAL and ALL VALID bearish signals. However, you're catching a reversal attempt on a newly-broken bullish pattern. This means:
- If resistance holds → You could see a sharp 8-15% drop to $0.71-$0.68 zone quickly
- If bulls break through → Momentum could carry to $0.85-$0.90 before exhausting
**Final Recommendation: TAKE THE TRADE - BUT WITH REDUCED SIZE & TIGHT RISK MANAGEMENT**
This setup has enough technical merit to take, but given the counter-trend nature and recent bullish breakout, I'd recommend:
- **Position Size**: 50% of normal size due to counter-trend risk
- **Entry**: $0.7720-$0.7780 (current zone)
- **Stop Loss**: $0.7981 (HARD STOP - no exceptions)
- **Target 1**: $0.7235 (take 50% off)
- **Target 2**: $0.7136-$0.7169 (take another 30% off)
- **Target 3**: $0.5974 (let 20% run if it really crashes)
- **Time Horizon**: 1-3 days for initial targets
**The Truth**: Your analysis is solid, your confluences are real, and your technical setup is valid. However, you're trying to catch a knife just after bulls broke out. If you can accept that risk, keep your size small, and honor your stop, this trade has excellent R/R. Just understand: if bulls push through $0.80 with volume, you need to exit immediately - don't fight a breakout with momentum.
**Bottom Line**: Skilled counter-trend setup with 5:1+ R/R, but requires discipline and smaller size due to swimming against recent momentum. The divergences and harmonic patterns say "reversal imminent," but the falling wedge breakout says "one more push higher possible." Trade it, but respect it. 🎯
all my paid ( pro ) scripts can be obtained for a low price of 19.99 / month at : whop.com/sabr-pro-tools/access-to-all-pro-tools/
Disclaimer
The information and publications are not meant to be, and do not constitute, financial, investment, trading, or other types of advice or recommendations supplied or endorsed by TradingView. Read more in the Terms of Use.