After its IPO, CoreWeave ( CRWV) exploded from $39 to $187, marking an impressive +380% gain in just a few months. However, following two missed earnings reports, sentiment cooled, leading to a broad retracement and multi-month consolidation. The upcoming earnings release could prove pivotal for the stock’s next major directional move.
Daily Chart Structure
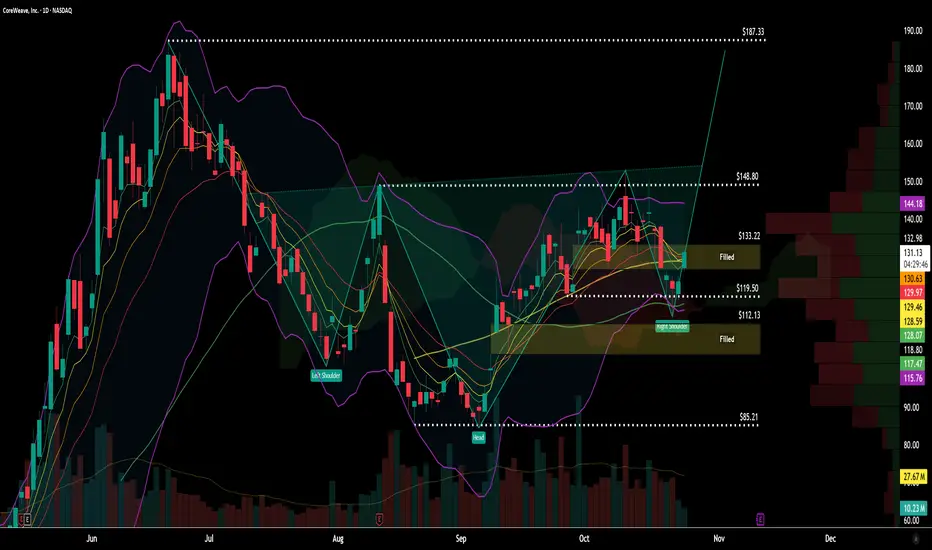
On the daily timeframe,CRWV has printed what appears to be a Kilroy bottom (complex inverted head-and-shoulders variant), though with an unusually complex structure — featuring two heads and two right shoulders.
The first head triggered a strong rally that faded quickly.
The second head formed a slightly higher low, maintaining bullish divergence.
The second right shoulder extended lower to search for liquidity, tagging the top of the early September breakaway gap before rebounding.
This secondary right shoulder also coincides with the lower Bollinger Band and Ichimoku cloud support, adding structural confluence.
Gap Behavior & Market Sentiment
Both prior gaps were filled rapidly, suggesting weak follow-through during prior upswings — a sign of underlying fragility in trend conviction. However, the new gap opening from the recent right shoulder introduces a potential reversal opportunity if supported by volume.
The key focus now shifts to the $148–$149 zone, which represents:
The neckline of the complex Kilroy formation
The upper boundary of prior range resistance
A zone of significant volume profile resistance on the right-hand side of the chart
A decisive break above $149 on strong volume would confirm pattern completion and open the door to a potential retest of the $187 post-IPO high.
Support & Risk Levels
Below current price, the chart offers several well-defined structural levels:
$133–$135: Minor support / gap fill area
$119.5: Reaction level from recent low
$112: Base of right shoulder and secondary liquidity zone
$85: Full retracement area if sentiment turns risk-off
As long as the right shoulder structure holds above $112, the base remains valid and the pattern’s bullish bias stays intact.
Technical Summary
✅ Pattern: Complex Kilroy bottom (2H/2RS)
✅ Trend: Stabilizing; higher lows emerging
📊 Key Resistance: $148–$149
⚠️ Support: $133 → $119 → $112
🎯 Upside target (if confirmed): $187 (post-IPO high retest)
🔍 Trigger: Volume-backed breakout above neckline
Final Notes
CoreWeave remains a volatile post-IPO name with strong structural setups but fragile sentiment. The chart suggests accumulation around recent lows, but confirmation will depend entirely on how price reacts into the $148–$149 resistance area.
If the upcoming earnings release delivers a positive catalyst and volume confirms, the measured move from the Kilroy base could complete, retesting the $187 zone in the following quarter.
For educational and technical analysis purposes only.
Daily Chart Structure
On the daily timeframe,
The first head triggered a strong rally that faded quickly.
The second head formed a slightly higher low, maintaining bullish divergence.
The second right shoulder extended lower to search for liquidity, tagging the top of the early September breakaway gap before rebounding.
This secondary right shoulder also coincides with the lower Bollinger Band and Ichimoku cloud support, adding structural confluence.
Gap Behavior & Market Sentiment
Both prior gaps were filled rapidly, suggesting weak follow-through during prior upswings — a sign of underlying fragility in trend conviction. However, the new gap opening from the recent right shoulder introduces a potential reversal opportunity if supported by volume.
The key focus now shifts to the $148–$149 zone, which represents:
The neckline of the complex Kilroy formation
The upper boundary of prior range resistance
A zone of significant volume profile resistance on the right-hand side of the chart
A decisive break above $149 on strong volume would confirm pattern completion and open the door to a potential retest of the $187 post-IPO high.
Support & Risk Levels
Below current price, the chart offers several well-defined structural levels:
$133–$135: Minor support / gap fill area
$119.5: Reaction level from recent low
$112: Base of right shoulder and secondary liquidity zone
$85: Full retracement area if sentiment turns risk-off
As long as the right shoulder structure holds above $112, the base remains valid and the pattern’s bullish bias stays intact.
Technical Summary
✅ Pattern: Complex Kilroy bottom (2H/2RS)
✅ Trend: Stabilizing; higher lows emerging
📊 Key Resistance: $148–$149
⚠️ Support: $133 → $119 → $112
🎯 Upside target (if confirmed): $187 (post-IPO high retest)
🔍 Trigger: Volume-backed breakout above neckline
Final Notes
CoreWeave remains a volatile post-IPO name with strong structural setups but fragile sentiment. The chart suggests accumulation around recent lows, but confirmation will depend entirely on how price reacts into the $148–$149 resistance area.
If the upcoming earnings release delivers a positive catalyst and volume confirms, the measured move from the Kilroy base could complete, retesting the $187 zone in the following quarter.
For educational and technical analysis purposes only.
Disclaimer
The information and publications are not meant to be, and do not constitute, financial, investment, trading, or other types of advice or recommendations supplied or endorsed by TradingView. Read more in the Terms of Use.
Disclaimer
The information and publications are not meant to be, and do not constitute, financial, investment, trading, or other types of advice or recommendations supplied or endorsed by TradingView. Read more in the Terms of Use.