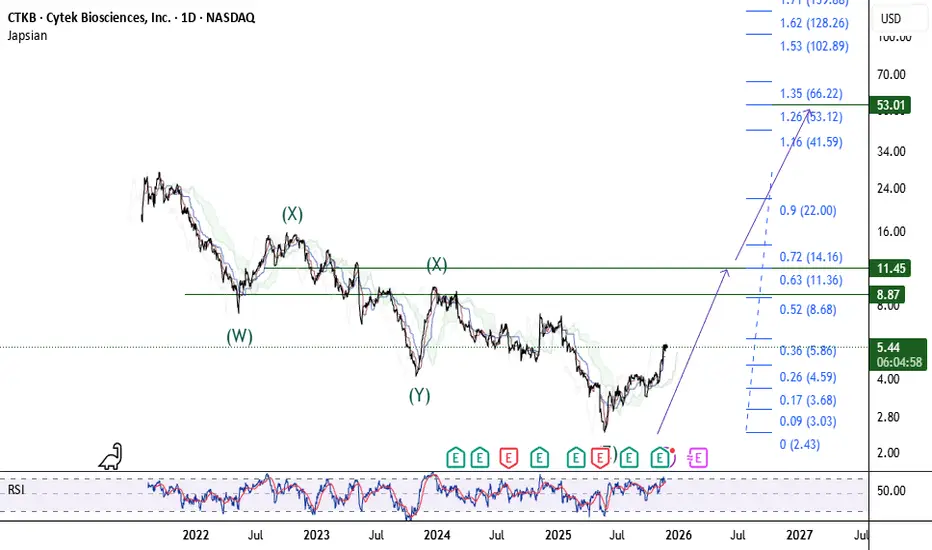
After completing what appears to be a complex corrective structure, this stock seems likely to make a retracement toward at least the 0.63 level (around $11.5) of the entire bearish wave. If it breaks above this zone, the long-term Fibonacci target at 1.26 (around $54) will be activated, which I’ve marked on the chart.
Disclaimer
The information and publications are not meant to be, and do not constitute, financial, investment, trading, or other types of advice or recommendations supplied or endorsed by TradingView. Read more in the Terms of Use.
Disclaimer
The information and publications are not meant to be, and do not constitute, financial, investment, trading, or other types of advice or recommendations supplied or endorsed by TradingView. Read more in the Terms of Use.