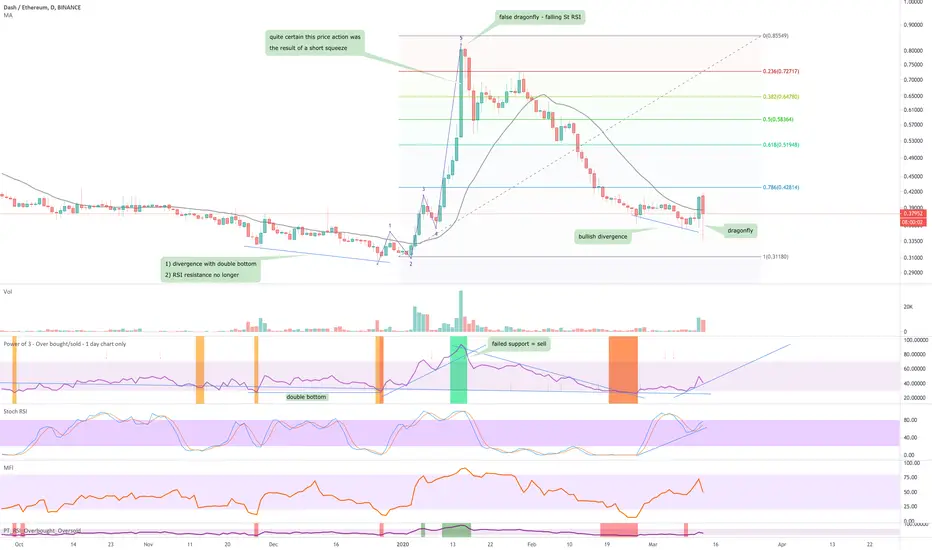
1-day chart showing us bullish divergence on the Dash / Ethereum pair together with Higher Lows on the Stochastic RSI following a (as if you hadn't noticed!) a strong oversold period. In addition price action has just made a band-to-band transition to the bullish half of the Bollinger band to find support on the 21-day moving average.
3-day - need to wait another two days to see if last candle does indeed form a dragonfly DOJI.

3-day - need to wait another two days to see if last candle does indeed form a dragonfly DOJI.
Trade closed: target reached
Wonderful - Just getting started it would seem.Note
Elliot wave correction complete, now is the moment to go long on Dash with your Ethereum.Note
The weekly chart printed a morning star at the close of last week, although we need this week to complete for full confirmation. However I'm confident following a strong oversold period that Dash will pull ahead of Ether without difficulty.Disclaimer
The information and publications are not meant to be, and do not constitute, financial, investment, trading, or other types of advice or recommendations supplied or endorsed by TradingView. Read more in the Terms of Use.
Disclaimer
The information and publications are not meant to be, and do not constitute, financial, investment, trading, or other types of advice or recommendations supplied or endorsed by TradingView. Read more in the Terms of Use.