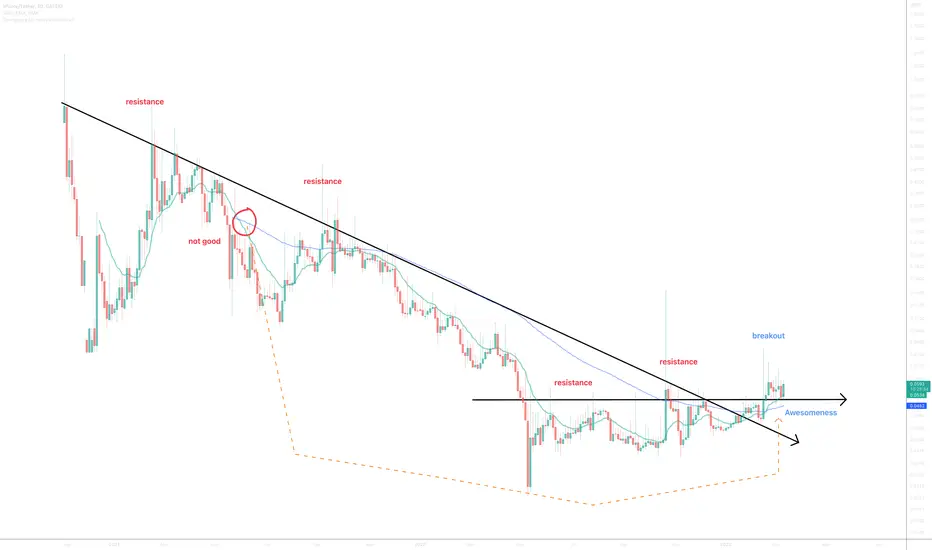
On the above 3-day chart price action has corrected over 90% since the early 2021. Now is a good opportunity to go long. Why?
1) A strong buy signal prints. (not shown).
2) Price action, RSI, and Money flow resistance breakouts.
3) Point (2) is also true for the BTC pair. Chart below.
4) The 3-day/40-day SMA crosses up the 3-day/100-day SMA. Very bullish for price action. These crosses were recorded on recent ideas such as Highstreet, ACH etc..
Is it possible price action could fall further? Sure.
Is it probable? No.
Ww
Type: trade
Risk: <=6% of portfolio
Timeframe: Don’t know.
Return: Don’t know.
3-day BTC pair
Trade active
Support confirmedNote
Up 40% so far. 6 cent resistance now broken. Next resistance test @ 12 cents.Trade active
support confirm, againDisclaimer
The information and publications are not meant to be, and do not constitute, financial, investment, trading, or other types of advice or recommendations supplied or endorsed by TradingView. Read more in the Terms of Use.
Disclaimer
The information and publications are not meant to be, and do not constitute, financial, investment, trading, or other types of advice or recommendations supplied or endorsed by TradingView. Read more in the Terms of Use.