After reviewing DigiByte on both the monthly and weekly timeframes - overlaid with Bitcoin’s macro cycle - the structure forming right now is one of the cleanest asymmetric setups I’ve seen in years. This idea outlines why DGB may be positioned for a 100–200× revaluation relative to USD - targeting a $8B–$20B market cap if the pattern resolves the way prior cycles have.
1. BTC Leads, DGB Lags — Same Setup as 2017 and 2021
Overlaying BTC on DGB reveals a consistent historical cycle:
1. BTC expands first
2. Altcoins lag during BTC’s vertical phase
3. Once BTC cools or consolidates, liquidity rotates outward
4. High-beta alts like DGB accelerate aggressively
This BTC → DGB lag effect preceded both the:
• 2017 ~150× DGB move
• 2021 ~80× DGB move
We are in the same structural position again.
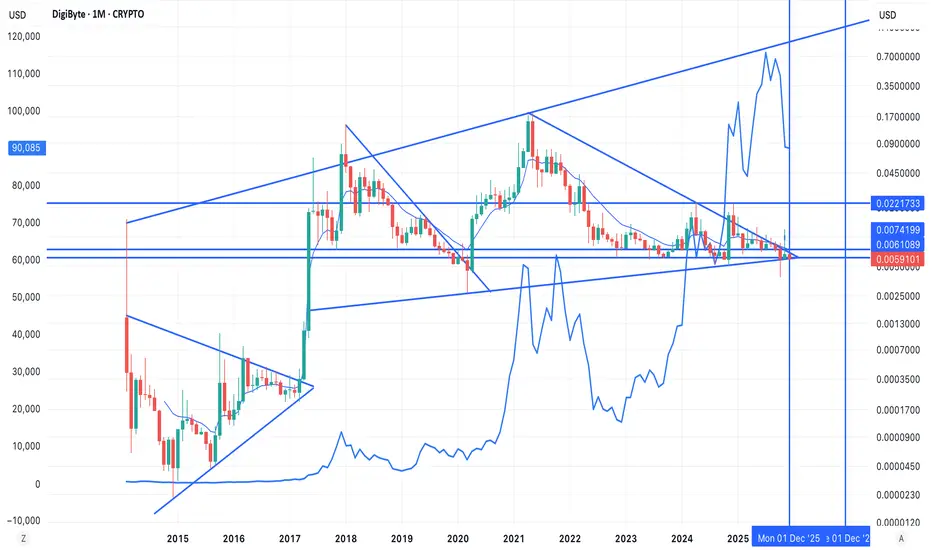
2. DGB Is Completing a Multi-Year Falling Wedge (2018–2025)
On the monthly chart, DigiByte is finishing a massive 5-year compression pattern:
• Price has respected the same horizontal accumulation floor since 2017
• Volatility has collapsed to cycle lows
• Each downside wick has been aggressively bought
• The wedge apex aligns with Q4 2025—the window altcoins historically begin major expansions
This is the exact signature of a high-timeframe breakout setup.
3. Long-Term Support Is Fully Intact
The 0.004–0.007 USD support zone has held for:
• 2017
• 2019
• 2020
• 2022
• 2023–2025
This level has acted as the macro accumulation floor for almost a decade.
The recent false breakdown and rebound back inside the wedge is a textbook spring.
4. High-Timeframe Charts Give a 100–200× Expansion Target
If DGB simply repeats prior altseason performance:
• 100× move = ~$8B market cap
• 200× move = ~$15–20B market cap
These values align cleanly with:
• Upper macro trend channels
• Fib extension confluence zones
• Historical BTC-relative performance
Given current compression, this move does not require unrealistic liquidity—just a standard altseason rotation.
5. Timing Aligns with BTC Dominance and Liquidity Cycles
The BTC overlay shows:
• BTC dominance is peaking
• BTC volatility is high but stalling
• Historically, this is when altcoins begin their acceleration phase
DGB’s wedge resolution lines up precisely with the expected rotation window.
Final View (Macro)
DigiByte is showing:
• Multi-year wedge completion
• Decade-long accumulation support
• BTC-leading / DGB-lagging cycle setup
• Extremely low volatility
• Compression ready for expansion
This is one of the most asymmetric risk-to-reward structures on the chart right now.
A confirmed breakout above the wedge resistance opens the door to the 100–200× range, consistent with DGB’s historical behavior during altseason expansions.
1. BTC Leads, DGB Lags — Same Setup as 2017 and 2021
Overlaying BTC on DGB reveals a consistent historical cycle:
1. BTC expands first
2. Altcoins lag during BTC’s vertical phase
3. Once BTC cools or consolidates, liquidity rotates outward
4. High-beta alts like DGB accelerate aggressively
This BTC → DGB lag effect preceded both the:
• 2017 ~150× DGB move
• 2021 ~80× DGB move
We are in the same structural position again.
2. DGB Is Completing a Multi-Year Falling Wedge (2018–2025)
On the monthly chart, DigiByte is finishing a massive 5-year compression pattern:
• Price has respected the same horizontal accumulation floor since 2017
• Volatility has collapsed to cycle lows
• Each downside wick has been aggressively bought
• The wedge apex aligns with Q4 2025—the window altcoins historically begin major expansions
This is the exact signature of a high-timeframe breakout setup.
3. Long-Term Support Is Fully Intact
The 0.004–0.007 USD support zone has held for:
• 2017
• 2019
• 2020
• 2022
• 2023–2025
This level has acted as the macro accumulation floor for almost a decade.
The recent false breakdown and rebound back inside the wedge is a textbook spring.
4. High-Timeframe Charts Give a 100–200× Expansion Target
If DGB simply repeats prior altseason performance:
• 100× move = ~$8B market cap
• 200× move = ~$15–20B market cap
These values align cleanly with:
• Upper macro trend channels
• Fib extension confluence zones
• Historical BTC-relative performance
Given current compression, this move does not require unrealistic liquidity—just a standard altseason rotation.
5. Timing Aligns with BTC Dominance and Liquidity Cycles
The BTC overlay shows:
• BTC dominance is peaking
• BTC volatility is high but stalling
• Historically, this is when altcoins begin their acceleration phase
DGB’s wedge resolution lines up precisely with the expected rotation window.
Final View (Macro)
DigiByte is showing:
• Multi-year wedge completion
• Decade-long accumulation support
• BTC-leading / DGB-lagging cycle setup
• Extremely low volatility
• Compression ready for expansion
This is one of the most asymmetric risk-to-reward structures on the chart right now.
A confirmed breakout above the wedge resistance opens the door to the 100–200× range, consistent with DGB’s historical behavior during altseason expansions.
Disclaimer
The information and publications are not meant to be, and do not constitute, financial, investment, trading, or other types of advice or recommendations supplied or endorsed by TradingView. Read more in the Terms of Use.
Disclaimer
The information and publications are not meant to be, and do not constitute, financial, investment, trading, or other types of advice or recommendations supplied or endorsed by TradingView. Read more in the Terms of Use.