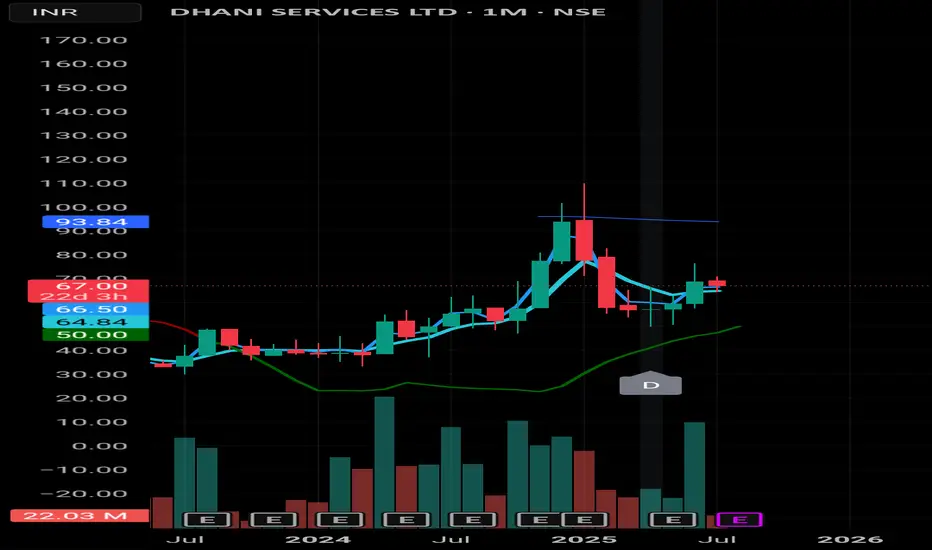
📉 Dhani Services Ltd – Monthly Chart Analysis
• Price: ₹67.17
• Setup: Attempting recovery after sharp fall from ₹100+ zone
• Facing resistance around 66.50–67.50 (20 EMA & previous support turned resistance)
• 93.84 – Long-term resistance (possibly 200 EMA)
• Support levels:
– ₹64.86 (short-term)
– ₹50.02 (major swing base & green trend line zone)
📊 Volume: Spiked again recently—watch for follow-through
🕯️ Candle shows buyers attempting to push, but supply overhead is strong
🎯 Game Plan:
– Above ₹68: possible upside towards ₹78–80
– Below ₹64: weakness may pull back to ₹56–50
🔁 Wait for strength to confirm. Don’t jump early on weak reversals.
#DhaniServices #StockMarketIndia #MonthlyChart #SwingTrading #PriceAction #NSEStocks #TechnicalAnalysis
Started like everyone else — chasing trends, ignoring risk.
Learned the hard way that survival beats prediction.
Now I share structured equity views and hedged options plays using Renko and macro context — built for consistency, not dopamine.
Learned the hard way that survival beats prediction.
Now I share structured equity views and hedged options plays using Renko and macro context — built for consistency, not dopamine.
Disclaimer
The information and publications are not meant to be, and do not constitute, financial, investment, trading, or other types of advice or recommendations supplied or endorsed by TradingView. Read more in the Terms of Use.