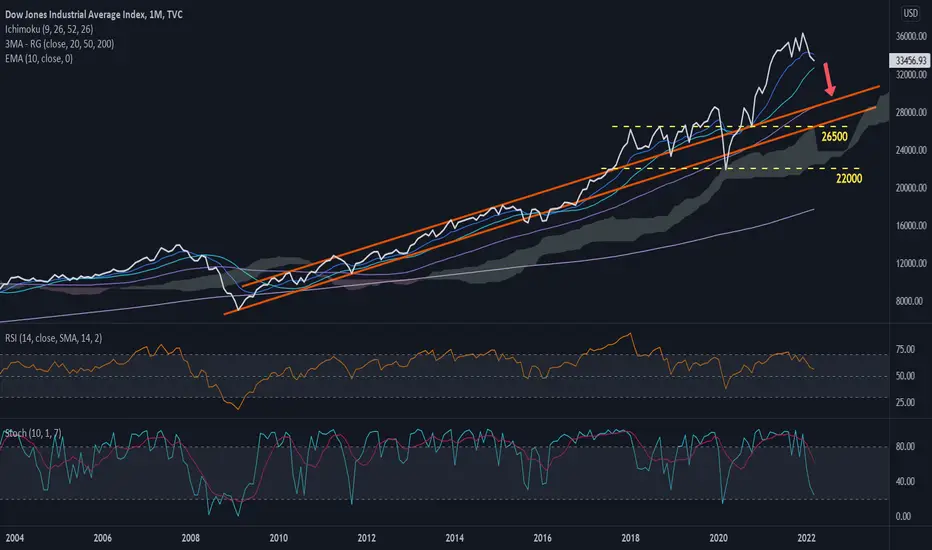
Some experts are warning of a severe market crash as rates rise in the U.S. and years of loose monetary policy are reigned in. Putting aside reasons and opinions, just look at monthly charts and see where price is today, relative to the moving averages and channels and trends since 2008. This chart is relevant for the next two years for me, as I watch RSI to see if goes below 50 and I watch %D stochastic head lower (see in 2008).
This chart shows the rising channel in orange lines since 2008. In 2017 markets took off and three years later fell back to the bottom of the channel. As the Fed "created money" and loosened credit after the Covid crash, dollars moved from the Treasury into the big banks and into the stock market. So we have to consider what will happen when this is reversed.
I am not trying to predict anything here. Rather I am acknowledging the technical chart-based possibility of a severe market correction. Sometimes it may feel like a waterfall, and other times it may be like rolling down a long hill. I am now starting some longer swing positions, while leaving most capital for day trades and short swings. My plan is to use profits from these short duration trades to increase long swing positions.
Note
To be clear, I am not expecting that markets continue dropping for all of March. Look at charts like ULTA, GOOG, APPL, IWM, MSFT and others, and you will see they all have room to move lower as changes occur in dollar value, rates, valuations, etc. I am bearish this week, but also looking for call setups by end of this week or next week. I am still choosing my swing trades based on weekly and daily charts.Mainly this chart is to inform investment decisions and longer term planning, and to raise awareness that the countrys' economy may be undergoing a cyclical shift.
Disclaimer
The information and publications are not meant to be, and do not constitute, financial, investment, trading, or other types of advice or recommendations supplied or endorsed by TradingView. Read more in the Terms of Use.
Disclaimer
The information and publications are not meant to be, and do not constitute, financial, investment, trading, or other types of advice or recommendations supplied or endorsed by TradingView. Read more in the Terms of Use.