🎯 STRATEGY SNAP: CLASSIC 'W' BOTTOM PATTERN IN ACTION
CHART SETUP:
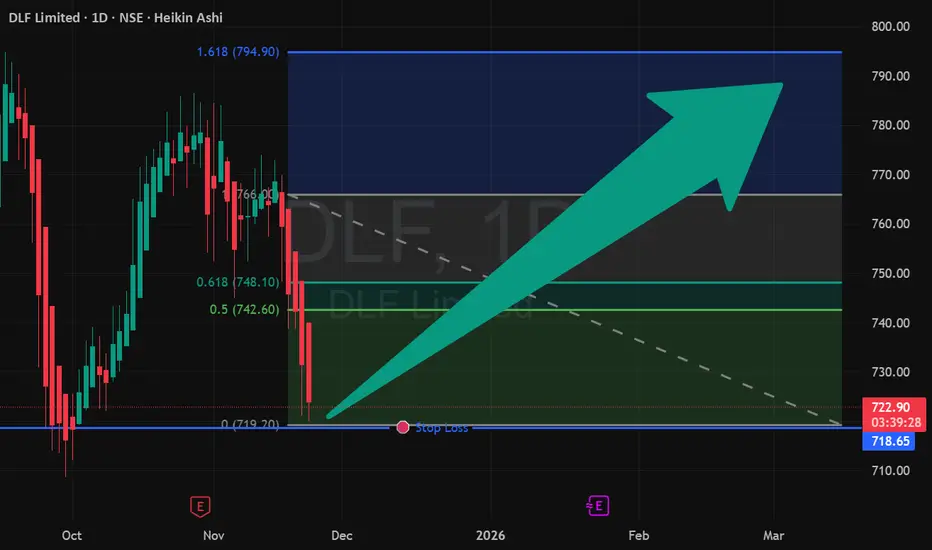
Stock: DLF (India)
Timeframe: Daily - Ideal for swing identification
Pattern: Bullish 'W' Formation (Double Bottom)
Key Feature: Right-side breakout above neckline
📊 STRATEGY EXECUTION PLAN:
ENTRY ZONE: ₹723 - ₹725
Optimal area for position initiation
Confirmation above pattern neckline
RISK MANAGEMENT:
Stop Loss: ₹715 (Below pattern support)
Risk Per Trade: ~1.4% from entry
Position Sizing: Standard 1-2% portfolio risk
PROFIT TARGETS:
Target 1: ₹740 (+2.1% return)
Target 2: ₹760 (+4.8% return)
Risk-Reward Ratio: 1:2.1 (Very favorable)
🎓 PATTERN EDUCATION - THE 'W' BOTTOM:
Why This Pattern Works:
Double Support Confirmation: Price tested ₹715 level twice and held
Neckline Break: Signal triggers above the W's peak
Volume Confirmation: Ideally should see increasing volume on breakout
Measured Move Projection: Pattern height suggests ₹760 target
Pattern Psychology:
First bottom: Sellers exhaust at support
Middle peak: Bulls attempt recovery
Second bottom: Final test of support confirms reversal
Breakout: Bulls take control above resistance
⚡ MY STRATEGY CRITERIA MET:
✅ Clear chart pattern identified
✅ Defined entry with confirmation
✅ Specific risk management levels
✅ Favorable risk-reward ratio
✅ Logical target projections
TRADE MANAGEMENT SUGGESTIONS:
Consider partial profit booking at Target 1
Trail stop loss to breakeven at Target 1
Let remaining position ride to Target 2
🔔 FOLLOW FOR MORE CHART PATTERN STRATEGIES!
#DLF #ChartPatterns #TechnicalAnalysis #StockMarket #SwingTrading #TradingStrategy #Investing
⚠️ DISCLAIMER: I am not a SEBI registered advisor. This is educational content demonstrating chart pattern analysis. Not a recommendation to buy/sell. Trade at your own risk. Past performance doesn't guarantee future results.
This educational approach positions you as a knowledgeable chart strategist rather than just a signal provider, which is exactly what TradingView Mind appreciates and promotes.
CHART SETUP:
Stock: DLF (India)
Timeframe: Daily - Ideal for swing identification
Pattern: Bullish 'W' Formation (Double Bottom)
Key Feature: Right-side breakout above neckline
📊 STRATEGY EXECUTION PLAN:
ENTRY ZONE: ₹723 - ₹725
Optimal area for position initiation
Confirmation above pattern neckline
RISK MANAGEMENT:
Stop Loss: ₹715 (Below pattern support)
Risk Per Trade: ~1.4% from entry
Position Sizing: Standard 1-2% portfolio risk
PROFIT TARGETS:
Target 1: ₹740 (+2.1% return)
Target 2: ₹760 (+4.8% return)
Risk-Reward Ratio: 1:2.1 (Very favorable)
🎓 PATTERN EDUCATION - THE 'W' BOTTOM:
Why This Pattern Works:
Double Support Confirmation: Price tested ₹715 level twice and held
Neckline Break: Signal triggers above the W's peak
Volume Confirmation: Ideally should see increasing volume on breakout
Measured Move Projection: Pattern height suggests ₹760 target
Pattern Psychology:
First bottom: Sellers exhaust at support
Middle peak: Bulls attempt recovery
Second bottom: Final test of support confirms reversal
Breakout: Bulls take control above resistance
⚡ MY STRATEGY CRITERIA MET:
✅ Clear chart pattern identified
✅ Defined entry with confirmation
✅ Specific risk management levels
✅ Favorable risk-reward ratio
✅ Logical target projections
TRADE MANAGEMENT SUGGESTIONS:
Consider partial profit booking at Target 1
Trail stop loss to breakeven at Target 1
Let remaining position ride to Target 2
🔔 FOLLOW FOR MORE CHART PATTERN STRATEGIES!
#DLF #ChartPatterns #TechnicalAnalysis #StockMarket #SwingTrading #TradingStrategy #Investing
⚠️ DISCLAIMER: I am not a SEBI registered advisor. This is educational content demonstrating chart pattern analysis. Not a recommendation to buy/sell. Trade at your own risk. Past performance doesn't guarantee future results.
This educational approach positions you as a knowledgeable chart strategist rather than just a signal provider, which is exactly what TradingView Mind appreciates and promotes.
Disclaimer
The information and publications are not meant to be, and do not constitute, financial, investment, trading, or other types of advice or recommendations supplied or endorsed by TradingView. Read more in the Terms of Use.
Disclaimer
The information and publications are not meant to be, and do not constitute, financial, investment, trading, or other types of advice or recommendations supplied or endorsed by TradingView. Read more in the Terms of Use.