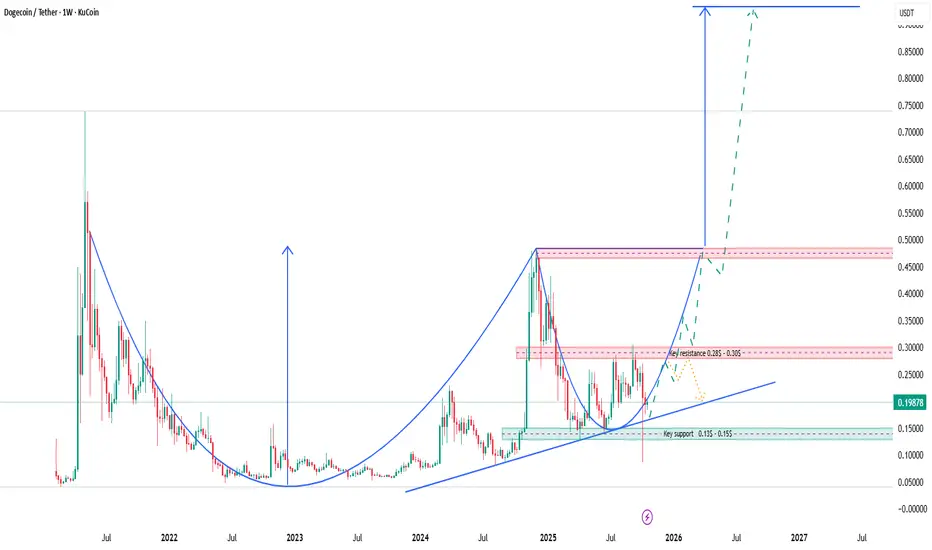
Dogecoin remains in a long-term accumulation phase between $0.13–$0.30. The current price around $0.20 shows stabilization after a major correction.
Key support: $0.13–$0.15 (strong historical zone)
Key resistance: $0.28–$0.30 — a breakout above could open the way to $0.45
Price is sitting near the 50-week MA, which may act as dynamic support.
Daily Trend:
DOGE is consolidating around $0.19–$0.20, forming a descending wedge, often a bullish reversal pattern.
RSI shows reduced selling pressure — momentum is building.
A breakout above $0.22 could trigger a move toward $0.27 → $0.30.
Losing $0.18 may lead to a retest of $0.15.
Scenarios:
Scenario Description Targets
🟢 Bullish Break above $0.22 $0.27 → $0.30 → $0.45
🔴 Bearish Drop below $0.18 $0.15 → $0.13
⚪ Neutral Range between $0.18–$0.22 Sideways until late November
Summary Quote :
“Dogecoin is charging up for its next move. A breakout above $0.22 could mark the start of a fresh rally toward $0.3 and beyond.”
Disclaimer
The information and publications are not meant to be, and do not constitute, financial, investment, trading, or other types of advice or recommendations supplied or endorsed by TradingView. Read more in the Terms of Use.
Disclaimer
The information and publications are not meant to be, and do not constitute, financial, investment, trading, or other types of advice or recommendations supplied or endorsed by TradingView. Read more in the Terms of Use.
