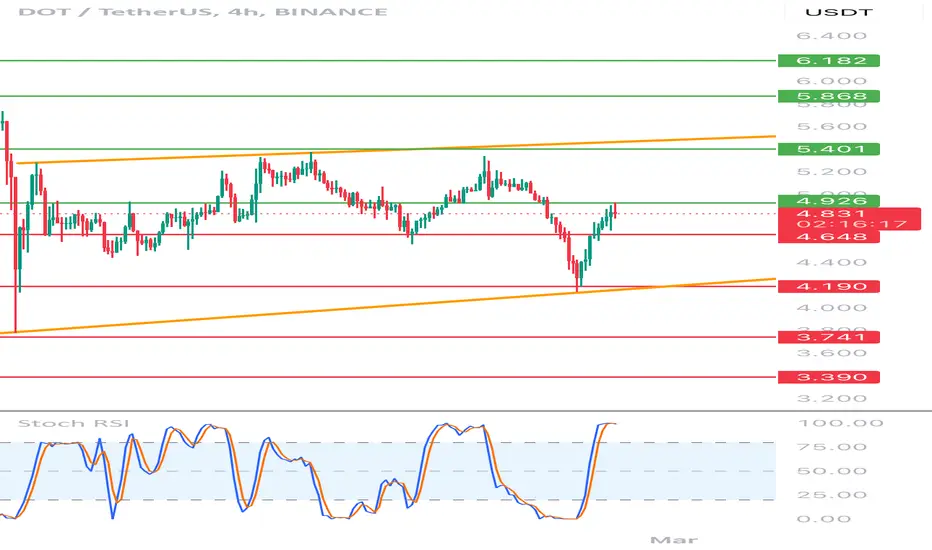
Hello everyone, let's look at the 4H Dot chart to USDT, in this situation we can see how the price moves in the local growth trend channel. However, let's start by defining goals for the near future the price must face:
T1 = $ 4.93
T2 = $ 5.40
Т3 = $ 5.87
T4 = $ 6.18
Let's go to Stop-Loss now in case of further declines on the market:
SL1 = 4.65 $
SL2 = 4.19 $
SL3 = $ 3,74
SL4 = $ 3.39
Looking at the RSI indicator, you can see the traffic above the upper limit of the range in the place where the price relief could be observed earlier.
Disclaimer
The information and publications are not meant to be, and do not constitute, financial, investment, trading, or other types of advice or recommendations supplied or endorsed by TradingView. Read more in the Terms of Use.
Disclaimer
The information and publications are not meant to be, and do not constitute, financial, investment, trading, or other types of advice or recommendations supplied or endorsed by TradingView. Read more in the Terms of Use.