Duolingo is a must for traders now
When I see Duolingo’s chart, I feel excitement.
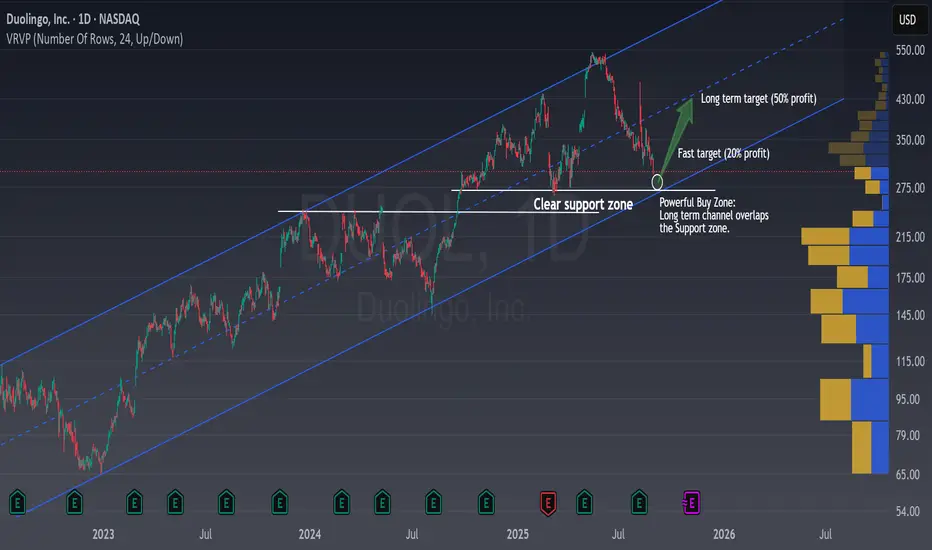
The stock has been on a long-term uptrend, moving inside a clear rising channel, but it has just suffered a pretty sharp drop, almost a 50% decline. That kind of move stings for anyone already holding, but for fresh eyes it feels like an opportunity knocking at the door.
What really jumps out is how perfectly the price has landed on a double safety net: A horizontal support zone that used to be resistance, and the lower boundary of the long-term channel. Whenever two big technical levels overlap like this, I start paying closer attention, because it often means buyers are sitting on the sidelines, waiting for the price to come down to their preferred level before jumping back in.
There are two clear targets: A quick rebound of around 20% if the bounce materializes, and a much larger 50% upside if the stock simply continues riding the channel higher.
In trading terms, this is what we’d call a clean risk/reward setup.
The risk here is very limited
If the price breaks below this support, the thesis is invalid and you cut your losses.
On the other hand, the potential reward is several times larger. Even in the most conservative scenario, you could aim for a 20% profit while risking only about 5%. And remember, that risk is taken with a clear, well-tested support zone, right at the bottom of the channel, and after a 50% decline from the highs.
Now, of course, it’s never just about lines on a chart.
The 15 analysts covering DUOL remain broadly bullish on Duolingo, with most price targets well above current levels, averaging $450.
That supports the technical case, but we can’t ignore the clouds on the horizon. Slowing user growth could hurt sentiment, competition from new AI-driven education tools is real, and heavy investment in expansion means margins will stay under pressure.
If any of those catalysts flare up, the support we’re leaning on here could give way quickly, but we could also seeDUOL leveraging AI in its favour, so the long term is always grey and I prefer to invest in what I can control.
Still, from a purely tactical point of view, this feels like one of those moments where both chart and fundamentals are in perfect alignment.
The stock has already fallen 50% from its all-time highs, which means the market has priced in a lot of bad news already. For someone willing to take the risk, buying here with a tight stop just under support makes sense: limited downside, plenty of upside.
Personally, I’d frame it like this: short-term traders can aim for the fast 20% rebound, while longer-term investors can think bigger, hold for (at least!) a potential 50% climb back toward the top of the channel, provided they’re comfortable weathering some volatility.
Either way, the golden rule applies: respect the stop. If support breaks, the story changes.
When I see Duolingo’s chart, I feel excitement.
The stock has been on a long-term uptrend, moving inside a clear rising channel, but it has just suffered a pretty sharp drop, almost a 50% decline. That kind of move stings for anyone already holding, but for fresh eyes it feels like an opportunity knocking at the door.
What really jumps out is how perfectly the price has landed on a double safety net: A horizontal support zone that used to be resistance, and the lower boundary of the long-term channel. Whenever two big technical levels overlap like this, I start paying closer attention, because it often means buyers are sitting on the sidelines, waiting for the price to come down to their preferred level before jumping back in.
There are two clear targets: A quick rebound of around 20% if the bounce materializes, and a much larger 50% upside if the stock simply continues riding the channel higher.
In trading terms, this is what we’d call a clean risk/reward setup.
The risk here is very limited
If the price breaks below this support, the thesis is invalid and you cut your losses.
On the other hand, the potential reward is several times larger. Even in the most conservative scenario, you could aim for a 20% profit while risking only about 5%. And remember, that risk is taken with a clear, well-tested support zone, right at the bottom of the channel, and after a 50% decline from the highs.
Now, of course, it’s never just about lines on a chart.
The 15 analysts covering
That supports the technical case, but we can’t ignore the clouds on the horizon. Slowing user growth could hurt sentiment, competition from new AI-driven education tools is real, and heavy investment in expansion means margins will stay under pressure.
If any of those catalysts flare up, the support we’re leaning on here could give way quickly, but we could also see
Still, from a purely tactical point of view, this feels like one of those moments where both chart and fundamentals are in perfect alignment.
The stock has already fallen 50% from its all-time highs, which means the market has priced in a lot of bad news already. For someone willing to take the risk, buying here with a tight stop just under support makes sense: limited downside, plenty of upside.
Personally, I’d frame it like this: short-term traders can aim for the fast 20% rebound, while longer-term investors can think bigger, hold for (at least!) a potential 50% climb back toward the top of the channel, provided they’re comfortable weathering some volatility.
Either way, the golden rule applies: respect the stop. If support breaks, the story changes.
⚡ Trading is not about luck or patience. Is about skills and knowledge. ⚡
I share my ideas, returns and knowledge here:
📚 👉 topchartpatterns.substack.com/subscribe 👈📚
🤝 Business contact: info@topchartpatterns.com
I share my ideas, returns and knowledge here:
📚 👉 topchartpatterns.substack.com/subscribe 👈📚
🤝 Business contact: info@topchartpatterns.com
Related publications
Disclaimer
The information and publications are not meant to be, and do not constitute, financial, investment, trading, or other types of advice or recommendations supplied or endorsed by TradingView. Read more in the Terms of Use.