Dollar - Low of the year is in. 3M CLS in playHi friends, new 3M CLS range created, Manipulated and price reacted on the key level at 95.5. Followed by strong rejection and Daily weekly CIOD ( change in order flow) Hence my target objective is now double top liquidity at 50% CLS range. It's quite long-term distance which will offer many shorter
U.S. Dollar Index
No trades
About U.S. Dollar Index
The U.S. Dollar Index tracks the strength of the dollar against a basket of major currencies. DXY was originally developed by the U.S. Federal Reserve in 1973 to provide an external bilateral trade-weighted average value of the U.S. dollar against global currencies. U.S. Dollar Index goes up when the U.S. dollar gains "strength" (value), compared to other currencies. The following six currencies are used to calculate the index:
Euro (EUR) 57.6% weight
Japanese yen (JPY) 13.6% weight
Pound sterling (GBP) 11.9% weight
Canadian dollar (CAD) 9.1% weight
Swedish krona (SEK) 4.2% weight
Swiss franc (CHF) 3.6% weight
Euro (EUR) 57.6% weight
Japanese yen (JPY) 13.6% weight
Pound sterling (GBP) 11.9% weight
Canadian dollar (CAD) 9.1% weight
Swedish krona (SEK) 4.2% weight
Swiss franc (CHF) 3.6% weight
Related indices

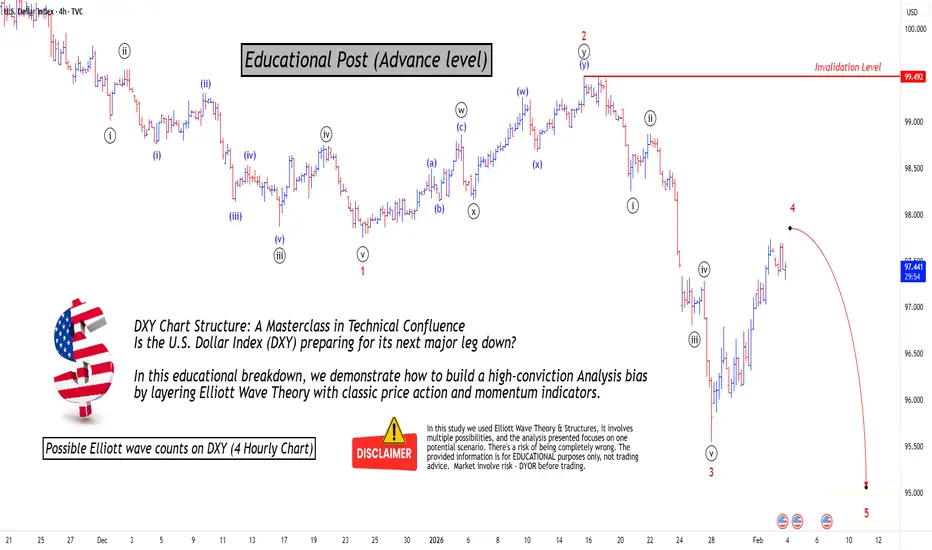
Mastering Technical:DXY Elliott Wave & Multi-Indicators AnalysisTechnical Analysis: DXY Bearish Confluence
This post serves as an educational guide on how various technical analysis tools converge to suggest a strong potential for a continued downtrend in the U.S. Dollar Index (DXY) on the 4-hour timeframe.
Elliott Wave Structure & Bearish Bias
The prevail
DXY: Follow The Price BreakoutDXY: Follow The Price Breakout
DXY is in a very complex situation. The price looks like it will rise, but we could also be in a different situation. The pattern is still developing and can take different forms, so only a price rise should solve this dilemma.
If DXY moves above the 96.75 pattern,

US DOLLAR INDEX (DXY): Classic Breakout TradeThe Dollar Index successfully broke and closed above a significant daily horizontal resistance cluster earlier this week.
Following this, the pair started to consolidate on a 4-hour timeframe, retesting the previously breached structure.
A bullish breakout of this consolidation serve as a strong

USD INDEX - BULLISH BUAS FOR FEB /MARCH 2026NICE multiple Monthly low rejections
Bias bullish towards 100 first and then 102

Dxy about to fall Dxy is retesting the breakdown when it's complete it should start to fall 91 - 90 is the Target.

Bearish reversal off pullback resistance?US Dollar Index (DXY) is rising towards the pivot, which acts as a pullback resistance and could reverse to the 1st support.
Pivot: 97.85
1st Support: 96.44
1st Resistance: 98.70
Disclaimer:
The opinions given above constitute general market commentary and do not constitute the opinion or advice

U.S Dollar IndexDXY
- Bullish Channel as an corrective pattern in Short Time Frame
- Fair Value Gap
- Order Block
- Completed " 123 " Impulsive Waves
- Fibonacci Level - 50.00% / 61.80%

Sell the USDFed will cut rates. Deleveraging events always pushed the Fed to cut regardless of who is Chair.
Buy 5 year bonds, not the back end. US debt burden will keep long rates elevated.
US is not a safe haven anymore = only EUR can fill that gap. Sell USD. Buy EUR, GBP,CHF,CAD,AUD.
Most currency trends ar

US DOLLAR H4 | Bearish Reversal The price is reacting off our sell entry level at 97.41, which is a pullback resistance.
Our stop loss is set at 98.07, which is a pullback resistance.
Our take profit is set at 96.19, which is a pullback support level.
High Risk Investment Warning
Stratos Markets Limited fxcm.com Stratos Europe

See all ideas
Summarizing what the indicators are suggesting.
Oscillators
Neutral
SellBuy
Strong sellStrong buy
Strong sellSellNeutralBuyStrong buy
Oscillators
Neutral
SellBuy
Strong sellStrong buy
Strong sellSellNeutralBuyStrong buy
Summary
Neutral
SellBuy
Strong sellStrong buy
Strong sellSellNeutralBuyStrong buy
Summary
Neutral
SellBuy
Strong sellStrong buy
Strong sellSellNeutralBuyStrong buy
Summary
Neutral
SellBuy
Strong sellStrong buy
Strong sellSellNeutralBuyStrong buy
Moving Averages
Neutral
SellBuy
Strong sellStrong buy
Strong sellSellNeutralBuyStrong buy
Moving Averages
Neutral
SellBuy
Strong sellStrong buy
Strong sellSellNeutralBuyStrong buy
Displays a symbol's value movements over previous years to identify recurring trends.
Frequently Asked Questions
The current value of U.S. Dollar Index is 97.681 USD — it has fallen by −0.27% in the past 24 hours. Track the index more closely on the U.S. Dollar Index chart.
U.S. Dollar Index reached its highest quote on Feb 25, 1985 — 164.720 USD. See more data on the U.S. Dollar Index chart.
The lowest ever quote of U.S. Dollar Index is 70.698 USD. It was reached on Mar 17, 2008. See more data on the U.S. Dollar Index chart.
U.S. Dollar Index value has increased by 1.58% in the past week, since last month it has shown a −1.07% decrease, and over the year it's decreased by −9.30%. Keep track of all changes on the U.S. Dollar Index chart.
U.S. Dollar Index is just a number that lets you track performance of the instruments comprising the index, so you can't invest in it directly. But you can buy U.S. Dollar Index futures or funds or invest in its components.