DXY Daily Timeframe – Technical & Fundamental Analysis
Fundamentals:
The U.S. economy continues to print strong economic data, which typically supports the dollar. However, the DXY has failed to create new highs and is currently sitting below key resistance. This suggests that much of the positive data is already priced in. With buying momentum slowing, there is an increasing probability that traders will begin taking profits — potentially triggering a sell-off.
Technicals:
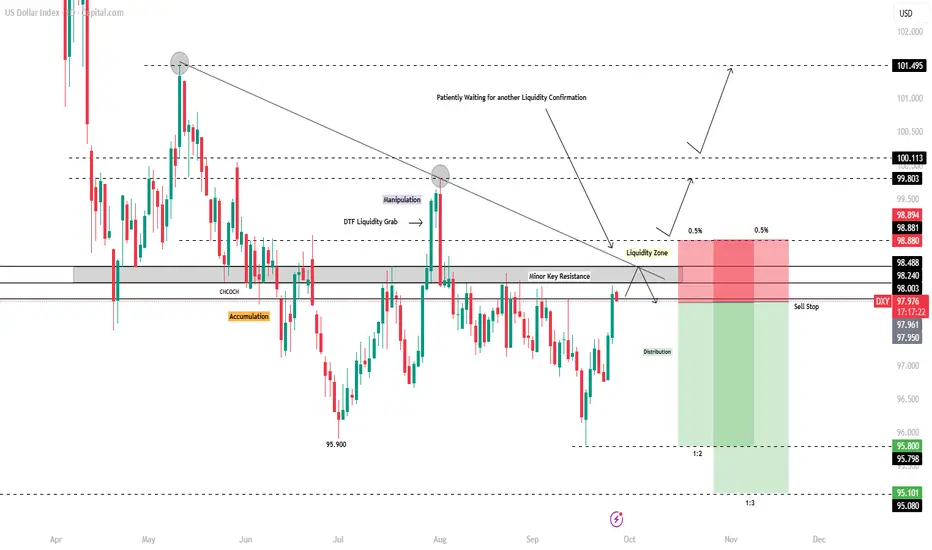
After a liquidity hunt/manipulation above previous highs, price broke below a key level, confirming a Change of Character (CHoCH).
Post-breakout, price accumulated sell positions under the key level and was driven lower, reaching as far as 95.900.
A pullback followed, with price retesting the minor key resistance at 98.300, but failing to break higher.
We are now watching closely for a liquidity grab within the 98.300–98.880 liquidity zone.
📌 Trading Plan (DTF Bias – Bearish):
Point of Interest (POI): 97.950
Stop Loss (SL): 98.880 (above liquidity zone)
Take Profit 1 (TP1): 95.800
Take Profit 2 (TP2): 95.100
📌 Disclaimer: This is not financial advice. Always wait for proper confirmation before executing trades. Manage your risk wisely and trade what you see—not what you feel.
Fundamentals:
The U.S. economy continues to print strong economic data, which typically supports the dollar. However, the DXY has failed to create new highs and is currently sitting below key resistance. This suggests that much of the positive data is already priced in. With buying momentum slowing, there is an increasing probability that traders will begin taking profits — potentially triggering a sell-off.
Technicals:
After a liquidity hunt/manipulation above previous highs, price broke below a key level, confirming a Change of Character (CHoCH).
Post-breakout, price accumulated sell positions under the key level and was driven lower, reaching as far as 95.900.
A pullback followed, with price retesting the minor key resistance at 98.300, but failing to break higher.
We are now watching closely for a liquidity grab within the 98.300–98.880 liquidity zone.
📌 Trading Plan (DTF Bias – Bearish):
Point of Interest (POI): 97.950
Stop Loss (SL): 98.880 (above liquidity zone)
Take Profit 1 (TP1): 95.800
Take Profit 2 (TP2): 95.100
📌 Disclaimer: This is not financial advice. Always wait for proper confirmation before executing trades. Manage your risk wisely and trade what you see—not what you feel.
Disclaimer
The information and publications are not meant to be, and do not constitute, financial, investment, trading, or other types of advice or recommendations supplied or endorsed by TradingView. Read more in the Terms of Use.
Disclaimer
The information and publications are not meant to be, and do not constitute, financial, investment, trading, or other types of advice or recommendations supplied or endorsed by TradingView. Read more in the Terms of Use.