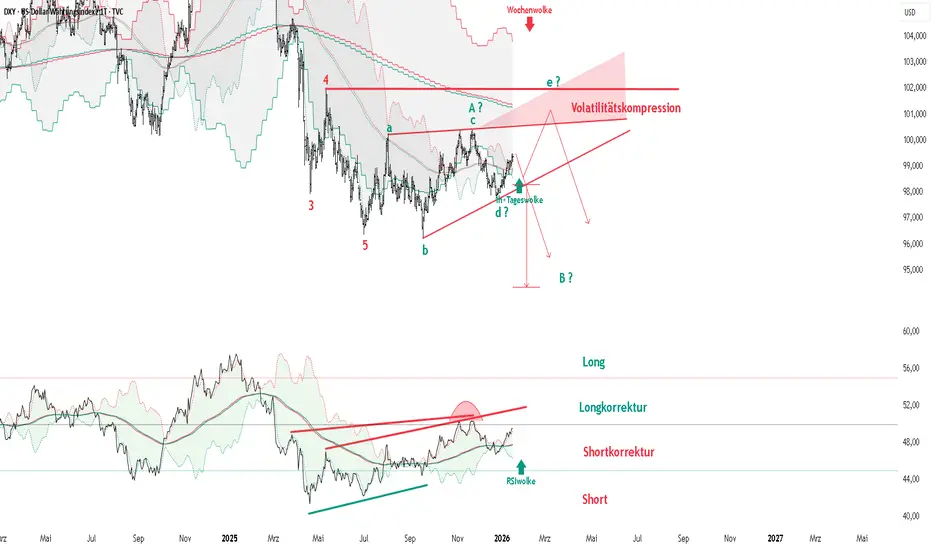
Alles Relevante ist direkt im Chart eingezeichnet und in der Wolke 2.0 klar ersichtlich.
Der Tageschart bildet dabei die entscheidende Mitte zwischen Wochen- und 1h-Chart.
Übrigens: Sowohl der DXY als auch BTC sind gestiegen.
Wochenchart

1h Chart

Was kann die Wolke 2.0 ?

Der Tageschart bildet dabei die entscheidende Mitte zwischen Wochen- und 1h-Chart.
Übrigens: Sowohl der DXY als auch BTC sind gestiegen.
Wochenchart
1h Chart
Was kann die Wolke 2.0 ?
Ohne Handelsstrategie bist Du an der Börse verloren...
Related publications
Disclaimer
The information and publications are not meant to be, and do not constitute, financial, investment, trading, or other types of advice or recommendations supplied or endorsed by TradingView. Read more in the Terms of Use.