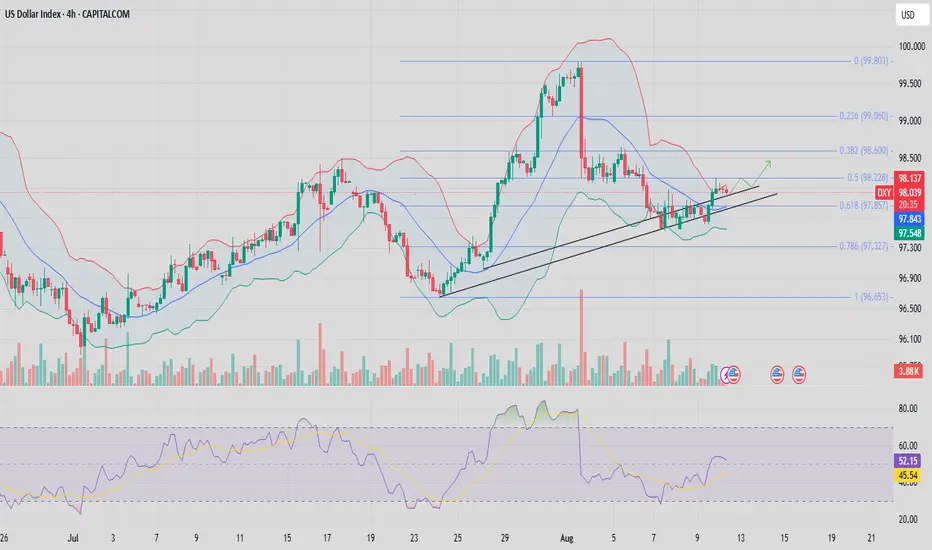
- The US Dollar Index (DXY) is trading near 98.50, just below the 50% Fibonacci retracement level (98.68) after breaking out from a minor descending channel, signaling a potential shift toward bullish momentum.
- Prices are now expected to test immediate resistance at 98.85, with further upside targets at 99.05 (38.2% Fib) and 99.25 if momentum sustains.
- Bollinger Bands are beginning to expand, and the RSI has recovered to 53, suggesting improving buying pressure but still room before entering overbought territory.
- On the downside, 98.31 (61.8% Fib) and 97.95 (lower Bollinger Band) remain key supports to watch.
- Traders awaiting the crucial US CPI and Core CPI data later today, volatility could spike sharply; a stronger-than-expected print may push DXY toward the 99.00–99.25 zone, while a softer reading risks a pullback toward 98.30 or lower.
Certified Market Technician
WA: +33755531401 +971545965565
marketinvestopedia.com/
WA: +33755531401 +971545965565
marketinvestopedia.com/
Disclaimer
The information and publications are not meant to be, and do not constitute, financial, investment, trading, or other types of advice or recommendations supplied or endorsed by TradingView. Read more in the Terms of Use.