🔹 1. What are Bollinger Bands?
Bollinger Bands are a popular technical analysis tool used to measure market volatility and identify overbought or oversold conditions. They consist of three lines plotted relative to price movements, helping traders assess price trends and potential reversal points. Developed by John Bollinger in the 1980s, these bands dynamically adjust based on market conditions, expanding during high volatility and contracting during low volatility.
🔹 2. Components

Middle Band (SMA - Simple Moving Average)
Upper Band
The Upper Band is calculated as:
Where:
This band represents an area of potential resistance and an overbought condition if the price approaches it.
Lower Band
The Lower Band is calculated as:
This band represents an area of potential support and an oversold condition if the price nears it.
🔹 3. Role of Standard Deviation in Bollinger Bands
Measuring Volatility
Adaptive to Market Conditions
Identifying Overbought & Oversold Conditions

🔹 4. History
1. John Bollinger and the Creation of Bollinger Bands
John Bollinger is a financial analyst, trader, and technical analyst. He is the president of Bollinger Capital Management and a Chartered Market Technician (CMT). He has written books and conducted extensive research on market analysis, risk management, and trading strategies.
2. How Did He Develop Bollinger Bands?
🔹 5. How Bollinger Bands Work
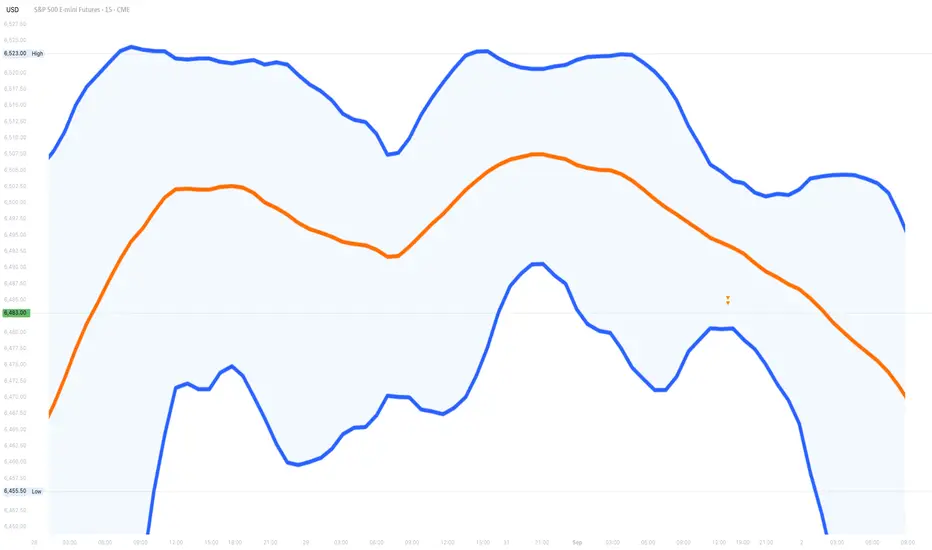
Bollinger Bands are a technical analysis tool designed to measure market volatility and identify potential trading opportunities.
They consist of three lines:
These bands dynamically adjust to price movements, expanding and contracting based on market volatility. The wider the bands, the higher the volatility, and the narrower the bands, the lower the volatility.
🔹 6. Bollinger Bands Formula
Bollinger Bands are built upon a statistical concept called standard deviation, which measures the dispersion of prices from their average. This allows the bands to expand and contract dynamically based on market volatility.

🔹 7. Interpreting Bollinger Bands
1. Identifying Overbought and Oversold Conditions
Bollinger Bands are widely used in trading because they provide insights into market conditions, trend strength, and potential reversal points.
📌 Important: Just because the price touches an outer band does not guarantee a reversal. Always use Bollinger Bands with other indicators, such as RSI (Relative Strength Index) or MACD (Moving Average Convergence Divergence), for confirmation.
2. Understanding Price Action Near the Bands
Strong Trends:
Reversal Signals:
Mean Reversion:
3. Understanding Market Signals
Support & Resistance
Trend Analysis
Compression & Expansion
Compression (bands tighten) breakout. Indicates low volatility before a breakout.
Expansion (bands widen) → trend continuation. Confirms volatility increase and trend continuation.
🔹 8. Strategies
1. Squeeze Strategy

How to Trade the Squeeze
📌 Example:
✅ Best for: Trending markets, breakout traders.
2. Breakout Strategy

How to Trade the Breakout
📌 Example:
✅ Best for: Trend-following traders, breakout traders.
🔹 9. Key Takeaways
Bollinger Bands are a popular technical analysis tool used to measure market volatility and identify overbought or oversold conditions. They consist of three lines plotted relative to price movements, helping traders assess price trends and potential reversal points. Developed by John Bollinger in the 1980s, these bands dynamically adjust based on market conditions, expanding during high volatility and contracting during low volatility.
🔹 2. Components
Middle Band (SMA - Simple Moving Average)
- The Middle Band is typically a 20-period Simple Moving Average (SMA).
- It represents the average price over the selected period and acts as a trend indicator.
Upper Band
The Upper Band is calculated as:
Upper Band=Middle Band+(k×σ)
Where:
- kkk is a constant (usually 2)
- σ\sigmaσ is the standard deviation of price over the same period
This band represents an area of potential resistance and an overbought condition if the price approaches it.
Lower Band
The Lower Band is calculated as:
Lower Band=Middle Band−(k×σ)
This band represents an area of potential support and an oversold condition if the price nears it.
🔹 3. Role of Standard Deviation in Bollinger Bands
Measuring Volatility
- Standard deviation (σ\sigmaσ) is a statistical measure of price dispersion.
- Higher standard deviation means larger price swings, causing the bands to expand.
- Lower standard deviation means smaller price swings, causing the bands to contract.
Adaptive to Market Conditions
- When volatility increases, the bands widen, signaling strong price movement.
- When volatility decreases, the bands contract, indicating a consolidation phase.
Identifying Overbought & Oversold Conditions
- When price touches the Upper Band, it suggests the asset might be overbought.
- When price touches the Lower Band, it suggests the asset might be oversold.
- However, these conditions alone do not guarantee a reversal—other confirmations are needed.
🔹 4. History
1. John Bollinger and the Creation of Bollinger Bands
John Bollinger is a financial analyst, trader, and technical analyst. He is the president of Bollinger Capital Management and a Chartered Market Technician (CMT). He has written books and conducted extensive research on market analysis, risk management, and trading strategies.
2. How Did He Develop Bollinger Bands?
- In the late 1970s and early 1980s, traders commonly used fixed-percentage bands, which plotted price channels around a moving average. However, these bands were ineffective because they did not account for changing market volatility.
- John Bollinger introduced the concept of standard deviation to measure volatility and dynamically adjust the bands. His key contributions were:
- Using a moving average (typically 20-period SMA) as the base.
- Calculating upper and lower bands by adding and subtracting a multiple (usually 2) of the standard deviation from the moving average.
- Recognizing that market volatility changes over time, meaning bands should expand and contract accordingly.
- This approach allowed traders to identify periods of low and high volatility, trend reversals, and breakout opportunities with much greater accuracy.
- Using a moving average (typically 20-period SMA) as the base.
🔹 5. How Bollinger Bands Work
Bollinger Bands are a technical analysis tool designed to measure market volatility and identify potential trading opportunities.
They consist of three lines:
- Upper Band – The Middle Band plus two standard deviations.
- Middle Band – A 20-period Simple Moving Average (SMA).
- Lower Band – The Middle Band minus two standard deviations.
These bands dynamically adjust to price movements, expanding and contracting based on market volatility. The wider the bands, the higher the volatility, and the narrower the bands, the lower the volatility.
🔹 6. Bollinger Bands Formula
Bollinger Bands are built upon a statistical concept called standard deviation, which measures the dispersion of prices from their average. This allows the bands to expand and contract dynamically based on market volatility.
🔹 7. Interpreting Bollinger Bands
1. Identifying Overbought and Oversold Conditions
Bollinger Bands are widely used in trading because they provide insights into market conditions, trend strength, and potential reversal points.
- Overbought Condition: When the price touches or moves above the Upper Band, it may indicate that the asset is overbought, meaning the price has risen too far, too fast. Traders may anticipate a pullback or a trend reversal. However, if a strong uptrend is in place, the price may continue to "ride" the Upper Band.
- Oversold Condition: When the price touches or moves below the Lower Band, it may indicate that the asset is oversold, meaning the price has fallen too sharply. This may signal a potential buying opportunity, especially if other indicators confirm it.
📌 Important: Just because the price touches an outer band does not guarantee a reversal. Always use Bollinger Bands with other indicators, such as RSI (Relative Strength Index) or MACD (Moving Average Convergence Divergence), for confirmation.
2. Understanding Price Action Near the Bands
Strong Trends:
- If the price moves along the Upper Band during an uptrend, it suggests strong bullish momentum.
- If the price moves along the Lower Band during a downtrend, it indicates strong bearish momentum.
Reversal Signals:
- If the price moves outside the bands and then quickly re-enters, it may signal a trend reversal.
- This can be useful in spotting fake breakouts or exhaustion moves.
Mean Reversion:
- Prices tend to revert to the Middle Band (SMA) after touching the Upper or Lower Band.
- Traders use this principle to buy near the Lower Band and sell near the Upper Band in ranging markets.
3. Understanding Market Signals
Support & Resistance
- If the price is above a band, it may act as support.
- If the price is below a band, it may act as resistance.
Trend Analysis
- Uptrends: Rising middle and upper bands. Downtrends: Falling middle and lower bands. Consolidation: Flat bands signal sideways movement before a breakout.
Compression & Expansion
Compression (bands tighten) breakout. Indicates low volatility before a breakout.
Expansion (bands widen) → trend continuation. Confirms volatility increase and trend continuation.
🔹 8. Strategies
1. Squeeze Strategy
- The Bollinger Band Squeeze occurs when the bands contract tightly, indicating low volatility.
- This signals a potential breakout, but it doesn’t predict the direction.
How to Trade the Squeeze
- 1. Identify when the bands are narrowing after a period of expansion.
- 2. Wait for the price to break above the Upper Band or below the Lower Band with strong momentum.
- 3. Enter a trade in the direction of the breakout.
- 4. Confirm the breakout with other indicators like RSI or MACD to avoid false signals.
- 5. Set stop-loss orders near recent price consolidation areas.
📌 Example:
- If the price breaks above the Upper Band, enter a long position (buy).
- If the price breaks below the Lower Band, enter a short position (sell).
✅ Best for: Trending markets, breakout traders.
2. Breakout Strategy
- A breakout occurs when the price moves outside the bands, signaling strong momentum.
- Traders use this as an opportunity to ride trends rather than fade them.
How to Trade the Breakout
- 1. Look for the price to close outside the Bollinger Bands (not just touch them).
- 2. Enter a trade in the direction of the breakout after confirming with volume or another momentum indicator.
- 3. Place a stop-loss near the Middle Band or recent swing low/high.
- 4. Exit the trade when the price starts consolidating or shows a reversal pattern.
📌 Example:
- If a stock closes above the Upper Band, enter a long trade.
- If a stock closes below the Lower Band, enter a short trade.
✅ Best for: Trend-following traders, breakout traders.
🔹 9. Key Takeaways
- Structure: Bollinger Bands consist of three lines —middle band (SMA), upper band (SMA + 2 * standard deviation), and lower band (SMA - 2 * standard deviation).
- Volatility Signals: The bands expand during high volatility and contract during low volatility, helping to identify potential breakouts or consolidations.
- Trend Indicators: The middle band acts as a trendline, with prices above it indicating an uptrend and below it suggesting a downtrend.
- Support and Resistance: The upper and lower bands typically act as dynamic resistance and support levels, respectively.
- Mean Reversion: In range-bound markets, prices tend to revert toward the middle band, offering potential entry points.
- Combination With Other Indicators: Bollinger Bands work best when used with other tools like RSI or Moving Averages to confirm signals and enhance trading strategies.
Get access to our exclusive tools: candelacharts.com
Join our community: discord.gg/etGSTepqbu
All content provided by CandelaCharts is for informational & educational purposes only.
Join our community: discord.gg/etGSTepqbu
All content provided by CandelaCharts is for informational & educational purposes only.
Disclaimer
The information and publications are not meant to be, and do not constitute, financial, investment, trading, or other types of advice or recommendations supplied or endorsed by TradingView. Read more in the Terms of Use.