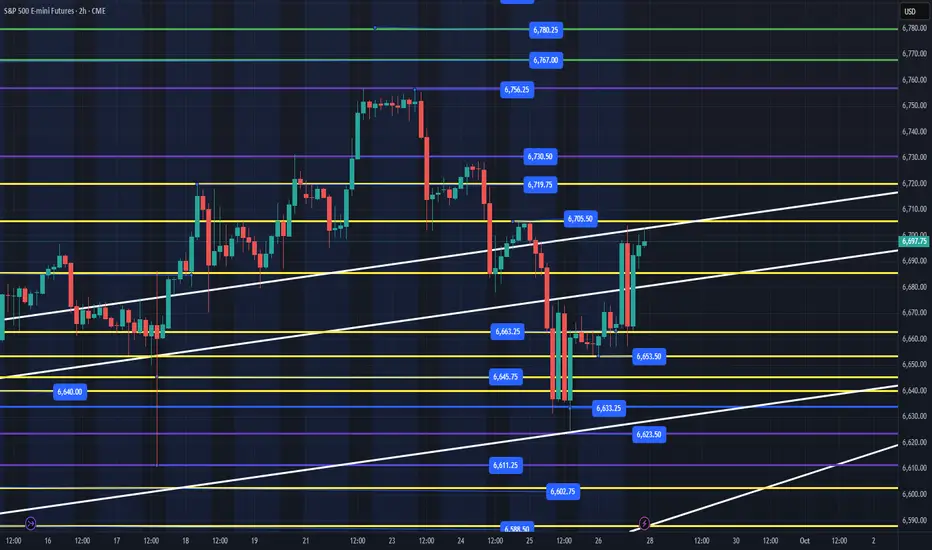
September 28th - 10:15am - Weekly Trade Plan
We had a great week, and Institutions continue to buy and keep price moving higher. We reached our weekly targets on Monday at 6750-52 then sold off to 6623 on Thursday which was the low of the week. Since Thursday Institutions have been buying and holding the 6653-6663 as the bull/bear line heading into this week. While price can flush lower, we really do not want to see anything lower than 6588 with a quick recovery of 6611 on a weekly basis.
Friday October 3rd is the big catalyst this week with the Employment Report at 8:30am
Key Support Levels - 6684, 6663, 6653, 6634, 6623, 6611, 6602, 6588
Key Resistance Levels - 6705, 6718, 6730, 6756
Weekly Targets - 6767, 6792, 6801, 6813+
Since we closed at the high of the day on Friday, I will post my Daily Trade Plan on Monday around 6am. That way we can see what price does in the overnight session. I anticipate that we hold the 6663 level with 6684 holding being bullish short term to continue up the levels. We could go parabolic this week into the 6800+ levels. I will be waiting on pullbacks to ride higher this week.
One thing to keep in mind is that this week is end of month/quarter and Institutions will be performing their window dressing to show clients how well their quarterly returns are doing. Unless price action changes, you have to follow the trend. Right now, the trend is up!
(I post a more detailed daily plan, and this allows me to focus on price action daily. The weekly plan is a bigger picture overview, but obviously that can change at any time based on daily price action) - *Follow me so you don't miss my daily updates
---------------------------------------------------------------------------------------------------------------------
Purple Levels - Weekly High/Low
Green Levels - Weekly Targets
Yellow Levels - Daily Key Levels (See Daily Trade Plan)
White - Rising trendlines from august lows
Note
October 1st, 2025 - 2:20pm - UpdateWe are closing in on our first target of the week at 6767 with price currently at 6763. I do expect a little pullback overnight with continued strength tomorrow as we head into the Jobs Report (Or not) based on the shutdown. I currently see us not losing 6740 on any back test and continue up to 6781 this week, which should be a strong resistance.
Note
October 3rd - 11:20am - We reached out 6792 target for the week. We can still go higher before end of day. You can review my daily plan from today to see what we were looking for this am.Related publications
Disclaimer
The information and publications are not meant to be, and do not constitute, financial, investment, trading, or other types of advice or recommendations supplied or endorsed by TradingView. Read more in the Terms of Use.
Related publications
Disclaimer
The information and publications are not meant to be, and do not constitute, financial, investment, trading, or other types of advice or recommendations supplied or endorsed by TradingView. Read more in the Terms of Use.