Happy Thanksgiving!
This is the second post in my series of monthly outlooks for ES futures. The first one, published in mid-October, covered the remainder of October and the outlook for November.
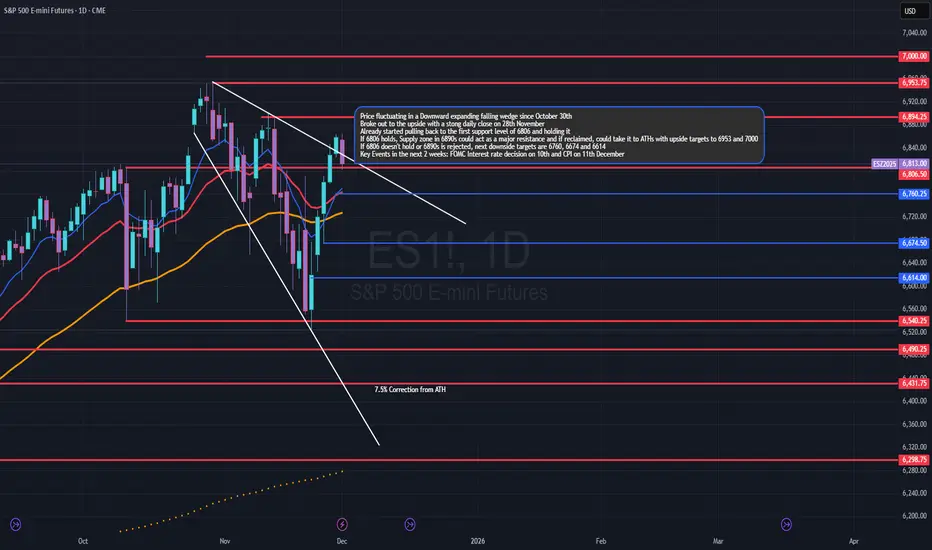
Since the end of October, price had been moving inside a downward-expanding falling wedge channel. On Friday, 28 November, ES finally broke out with a strong bullish daily close above the structure—although on lower volume due to the Thanksgiving week.
From here, two primary scenarios can unfold:
________________________________________
Scenario 1: Bullish Continuation Toward 6895+
Price remains bullish by successfully retesting the 4-hour 200 SMA (~6780) and advancing toward the next major supply zone around 6895. A few confluences support this scenario:
• The 200 SMA aligns with the 23.6% Fibonacci retracement from the 21 November low to the current swing high.
• This area also overlaps with the zone where the 10 October sell-off originated.
If this zone holds on the retest, ES could potentially push to new all-time highs by month-end, with intermediate upside targets at:
• 6894
• 6953
• 7000
________________________________________
Scenario 2: Rejection From 6890s Supply Zone
Price fails to break through the 6890s supply, rejects sharply, and continues lower—forming a third lower high below 6900.
Key downside levels under this scenario include:
• 6760
• 6674
• 6614
The major demand zone to watch is 6432 (the 7.5% correction level), which served as a strong bounce area multiple times in August and September.
________________________________________
Probability Tilt: Slight Edge to Scenario 1
From a probability standpoint, Scenario 1 currently has a slightly higher chance of playing out. Reasons:
• Price is trading above all three short-term EMAs: 9, 21, and 50.
• The 9 EMA is about to cross above the 21 EMA, a setup that historically leads more often to sideways consolidation followed by continuation to the upside, rather than a breakdown.
________________________________________
Institutional Buying Zones: Impact of % Corrections
When ES hits a new ATH and begins to retrace, certain correction percentages tend to attract institutional bids. These are typically:
• 5%
• 7.5%
• 10%
The current ATH is 6953.75, giving the following key correction levels:
• 5% correction: 6606
• 7.5% correction: 6432
• 10% correction: 6258
Recent examples support this pattern:
• The latest ATH (30 October) saw a 5% correction on 18 November, which led to a rally to 6790—about a 190-point bounce before the 20 November sell-off.
• The August 2024 low was roughly a 10% pullback from that era’s ATH.
• The December 2024 sell-off following the Fed meeting was roughly a 5% correction.
If Scenario 2 plays out, I will be watching 6432 very closely, given the confluence of the 7.5% correction and a historically strong demand zone.
________________________________________
ATR & Volatility Outlook:
For the past 9 consecutive weeks, the weekly ATR has exceeded 200 points, meaning ES has moved 200+ points on average per week.
Given that price rallied 300+ points from the 21 November low of 6525 within a single week, a period of consolidation next week is likely.
Volatility should return during the second week of December due to:
• FOMC interest rate decision — 10 December
• CPI data — 11 December
Given this macro calendar, I expect either a new ATH or a move toward 6674 within the next two weeks.
Hope this analysis helps. Open to feedback, discussion, and improvements. Happy trading.
This is the second post in my series of monthly outlooks for ES futures. The first one, published in mid-October, covered the remainder of October and the outlook for November.
Since the end of October, price had been moving inside a downward-expanding falling wedge channel. On Friday, 28 November, ES finally broke out with a strong bullish daily close above the structure—although on lower volume due to the Thanksgiving week.
From here, two primary scenarios can unfold:
________________________________________
Scenario 1: Bullish Continuation Toward 6895+
Price remains bullish by successfully retesting the 4-hour 200 SMA (~6780) and advancing toward the next major supply zone around 6895. A few confluences support this scenario:
• The 200 SMA aligns with the 23.6% Fibonacci retracement from the 21 November low to the current swing high.
• This area also overlaps with the zone where the 10 October sell-off originated.
If this zone holds on the retest, ES could potentially push to new all-time highs by month-end, with intermediate upside targets at:
• 6894
• 6953
• 7000
________________________________________
Scenario 2: Rejection From 6890s Supply Zone
Price fails to break through the 6890s supply, rejects sharply, and continues lower—forming a third lower high below 6900.
Key downside levels under this scenario include:
• 6760
• 6674
• 6614
The major demand zone to watch is 6432 (the 7.5% correction level), which served as a strong bounce area multiple times in August and September.
________________________________________
Probability Tilt: Slight Edge to Scenario 1
From a probability standpoint, Scenario 1 currently has a slightly higher chance of playing out. Reasons:
• Price is trading above all three short-term EMAs: 9, 21, and 50.
• The 9 EMA is about to cross above the 21 EMA, a setup that historically leads more often to sideways consolidation followed by continuation to the upside, rather than a breakdown.
________________________________________
Institutional Buying Zones: Impact of % Corrections
When ES hits a new ATH and begins to retrace, certain correction percentages tend to attract institutional bids. These are typically:
• 5%
• 7.5%
• 10%
The current ATH is 6953.75, giving the following key correction levels:
• 5% correction: 6606
• 7.5% correction: 6432
• 10% correction: 6258
Recent examples support this pattern:
• The latest ATH (30 October) saw a 5% correction on 18 November, which led to a rally to 6790—about a 190-point bounce before the 20 November sell-off.
• The August 2024 low was roughly a 10% pullback from that era’s ATH.
• The December 2024 sell-off following the Fed meeting was roughly a 5% correction.
If Scenario 2 plays out, I will be watching 6432 very closely, given the confluence of the 7.5% correction and a historically strong demand zone.
________________________________________
ATR & Volatility Outlook:
For the past 9 consecutive weeks, the weekly ATR has exceeded 200 points, meaning ES has moved 200+ points on average per week.
Given that price rallied 300+ points from the 21 November low of 6525 within a single week, a period of consolidation next week is likely.
Volatility should return during the second week of December due to:
• FOMC interest rate decision — 10 December
• CPI data — 11 December
Given this macro calendar, I expect either a new ATH or a move toward 6674 within the next two weeks.
Hope this analysis helps. Open to feedback, discussion, and improvements. Happy trading.
Disclaimer
The information and publications are not meant to be, and do not constitute, financial, investment, trading, or other types of advice or recommendations supplied or endorsed by TradingView. Read more in the Terms of Use.
Disclaimer
The information and publications are not meant to be, and do not constitute, financial, investment, trading, or other types of advice or recommendations supplied or endorsed by TradingView. Read more in the Terms of Use.