September 3rd - 7:25am EST
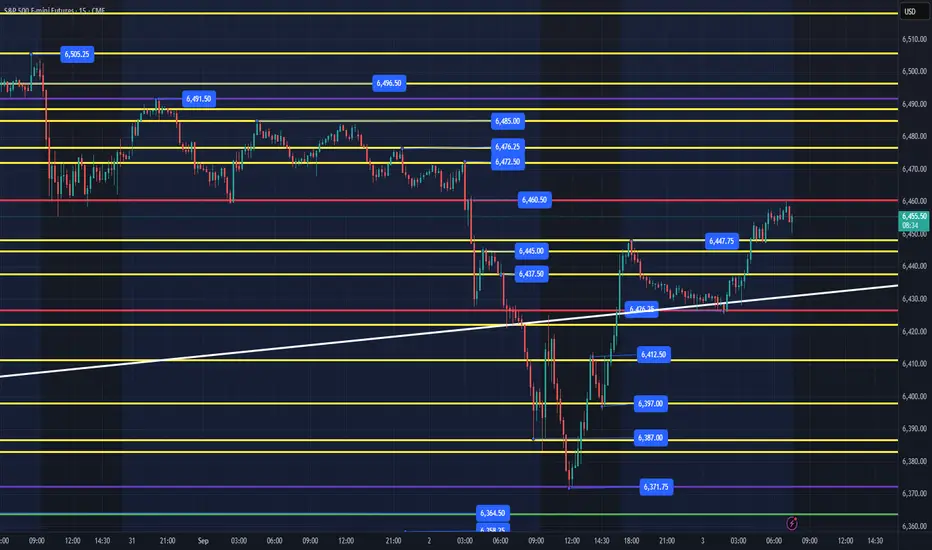
I wanted to provide an update on today's levels and what has transpired overnight. Price opened around 6448 and grinded down into the white trendline support. This trendline you can also see on the weekly chart (See Related Publications) and yesterday when we dropped below it, we then retested it at 6423 level, tested again in the afternoon to 6426, and we have then back tested it this evening down to 6426 and rallied from there, broke above the overnight high of 6448 and have come into resistance at 6460.
Couple of things about how I color code my levels.
1. Purple shows the weekly High/Low
2. Red shows the current overnight session High/Low
3. Zoom out on a 4hr, 6hr, chart and you will see a trendline from August 22 Low at 6364 which started the massive move to 6496. It is also the same trendline connecting the August 1st low that rallied to 6508. Both levels created rallies that lasted for 200+ pts. That does not mean we will see another rally like that, unless we can reclaim the weekly high of 6491 and then take it level to level from there.
Our first support down is the 6448 level. A flush and reclaim of this level, should take us higher. Each level in yellow are areas that price could flush, recover and climb level to level. My edge as a trader is to try and take 10pts+ out of the market and generally I am looking to do that by flushing a high-quality level, recover and ride it to the next level.
Immediate Resistances - 6460, 6472, 6476, 6485
Immediate Supports - 6448, 6437, 6426, 6412
Ideally, we need to hold the 6426 level or flush and reclaim quickly. IF, price can't rally above 6476, my lean is we are in the midst of a change in character of price, and I will be looking lower for levels to flush and reclaim.
I will send out an update around 10am.
Note
9:50am - Update Price really chopped around the 6444-6454 level between 8:30am-9:45am. I bought at 6447 and sold at 6451.75 around 9:20am as price was not showing follow through and we had the open coming up that I hate to be in especially since we have chopped around this range all night. We need to clear 6454 from here or flush down to 6439 area, then reclaim the 6444 area. I am patiently waiting for price to rip through the 6454 area and I can look for a back test or ideally, we drop to 6438 with a reclaim of 6444. The most reliable setup would be waiting for price to flush the overnight low at 6426, reclaim and ride up the levels. As of writing we are in a chop fest and price needs to flush lower, then rally ideally. IF, price can't bounce and reclaim the overnight low, I would get out the way and see what level price can build a new base.
Note
10:05am - UpdatePrice flushed down to 6439.25, rallied to 6451, back tested 6444 and I am now long at 6444 with a stop at 6442. IF, we lose 6444, we will probably retest the 6439 level and potentially lower.
Note
10:13am - UpdateI stopped out my position at 6445.50 for a small gain. Price is very choppy, and I will now sit back and wait for price to flush the low of the day at 6426 and reclaim for a move back up levels. Everything in between is noise, and we are not seeing follow through that is bullish IMO. Take a look at a 10 min chart and you can see the sellers have been coming in since yesterdays close as the wicks above the candles have been showing selling as price has moved lower. We can still shake the trend, but I would rather wait for a high-quality setup which is the 6426 flush and recovery.
Note
10:53am - Well, they flushed the 6438 level one more time and took off. We back tested 6444 level around 10:30am and moved to session highs. I did not personally take the new move higher as I was waiting for price to flush the overnight session low, it is good to know that 6438-6448 zone is where institutions have been buying today. That may become a significant level the rest of the week. I did get 6pts today which doesn't seem much, but I am positive on the day and took very little risk. Tomorrow is a new day, and I will wait for price to reset before I determine my next level to enter as we are coming into the lower volume part of the day between 11:30am-2pm. Tomorrow's trade plan will be out this evening.Related publications
Disclaimer
The information and publications are not meant to be, and do not constitute, financial, investment, trading, or other types of advice or recommendations supplied or endorsed by TradingView. Read more in the Terms of Use.
Related publications
Disclaimer
The information and publications are not meant to be, and do not constitute, financial, investment, trading, or other types of advice or recommendations supplied or endorsed by TradingView. Read more in the Terms of Use.