October 12th - 5:45pm
We had a great week, and Institutions continued to buy and keep price moving higher to our first weekly targets of 6807, 6813. On Friday, price looked like it was trying to go higher and then we got our first big "Trump Tweet" that gave Institutions an opportunity to sell! When we sell off like we did, it tells me that Institutions have been distributing heavily since FOMC in September. They had been building a nice base between 6741 - 6813 and with the right headline, it is time for them to sell. This level of selling, also shows you how leveraged retail traders were long, heading into this week!
I said last week that "we really need to hold the 6750 level, or we will need to pull back further for us to find liquidity to move higher. Ideally, we pull back to the 6720-25 level and then continue higher. IF, we lose the 6705 level, we will most likely need to retest last week's low at 6680-85."
I stated on my daily trade plan at 9:54am - Update
"Big sellers stepped in at 6807 level. Price really needs to hold 6790 lowest or this could be a false breakout, and we would continue lower down the levels. Bullish if price reclaims 6794."
Then on the 11:01am- Update
"Big sell off and not something you want to stand in the way of trying to pick a bottom. I mentioned that we needed to hold 6750 or we would see lower prices at 6729 first level, then 6705. The way the market just sold off, it will take a while for a base to build and shorts to get squeezed. I would be patient, and I may not trade again today. I will see how price does this afternoon."
My edge never gave me another opportunity for a trade the rest of Friday and honestly, anyone that said they went long on Friday, was gambling and, IF, profitable was lucky. IF, you truly watched price action it was running 10+pts up and down ranges so fast that it was very difficult trading conditions.
Let's talk about this week!
--------------------------------------------------------------------------------------------------------------
I have tried to clean up the weekly chart to keep it as simple as possible since we lost some major levels and are down at early September levels. We did sell off in the after-hours even further down to around 6540. Any loss this evening of that level and reclaim of it in the overnight session, will be a good start for us to back test the levels higher. IF, this is just a regular buy the dip after a sell off, we should be able to reclaim 6740 and hold 6680 by end of the week. The strength over the next couple of weeks will really determine, IF, we can continue the bull run above 6813. We have not had 2 red weeks back-to-back since the April low. We have to take price day to day and week to week. Overall, we are still in a bullish trend and that really won't change until we lose 6300 level as first big warning sign. Until then, we need to expect a buy the dip regime to continue!
When ES sells off the way it did, we have a very high probability that a short squeeze is coming in the next day or so.
How do we ride with the institutions for the back test of the loss of the 6762-66 level?
We find good levels that we can enter at and ride price higher.
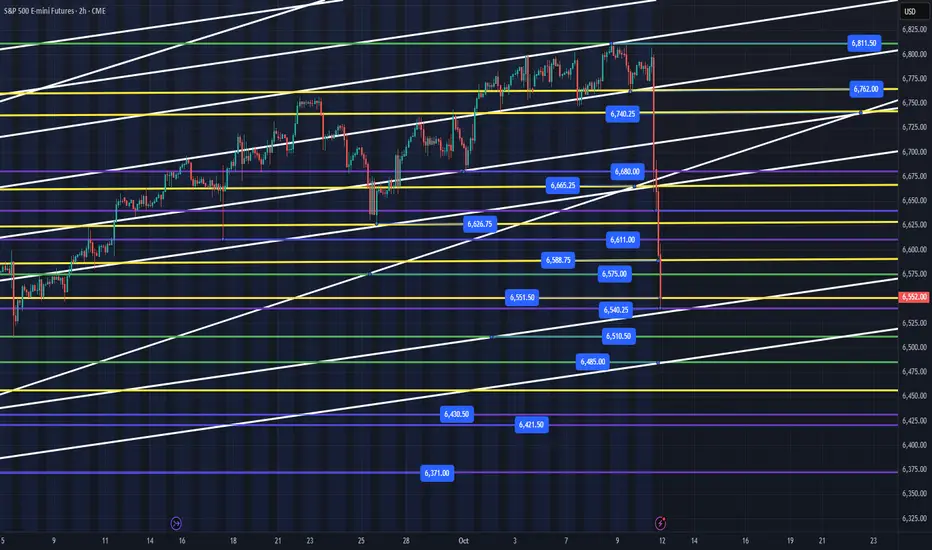
Key Support Levels - 6540, 6510, 6485, 6460, 6430, 6421, 6371
Key Resistance Levels - 6551, 6575, 6588, 6611, 6626, 6665, 6680, 6705, 6740
Ideally, we will start to build a base below 6540 overnight and then we can catch the reclaim of that level for a move higher. I could also see us lose 6540, flush down to 6510 or 6485, bounce to retest the 6540 level, come back down overnight, get everyone scared it's going to flush again and then provide a massive, short squeeze.
IF, price does reclaim 6540, the reclaim of 6575, 6588, 6611 are next 3 levels above that we can try and find some structure built at for a move up the levels.
I have no idea what price will do at the open and during the overnight session. I will post my Daily Trade Plan by 6am EST after the overnight session to get a sense for what levels we want to try, and grab points out of tomorrow.
-------------------------------------------------------------------------------------------------------------
Purple Levels - Weekly High/Low
Green Levels - Weekly Targets
Yellow Levels - Daily Key Levels (See Daily Trade Plan)
White - Trendlines that may produce support/resistance alongside the horizontal trendlines
We had a great week, and Institutions continued to buy and keep price moving higher to our first weekly targets of 6807, 6813. On Friday, price looked like it was trying to go higher and then we got our first big "Trump Tweet" that gave Institutions an opportunity to sell! When we sell off like we did, it tells me that Institutions have been distributing heavily since FOMC in September. They had been building a nice base between 6741 - 6813 and with the right headline, it is time for them to sell. This level of selling, also shows you how leveraged retail traders were long, heading into this week!
I said last week that "we really need to hold the 6750 level, or we will need to pull back further for us to find liquidity to move higher. Ideally, we pull back to the 6720-25 level and then continue higher. IF, we lose the 6705 level, we will most likely need to retest last week's low at 6680-85."
I stated on my daily trade plan at 9:54am - Update
"Big sellers stepped in at 6807 level. Price really needs to hold 6790 lowest or this could be a false breakout, and we would continue lower down the levels. Bullish if price reclaims 6794."
Then on the 11:01am- Update
"Big sell off and not something you want to stand in the way of trying to pick a bottom. I mentioned that we needed to hold 6750 or we would see lower prices at 6729 first level, then 6705. The way the market just sold off, it will take a while for a base to build and shorts to get squeezed. I would be patient, and I may not trade again today. I will see how price does this afternoon."
My edge never gave me another opportunity for a trade the rest of Friday and honestly, anyone that said they went long on Friday, was gambling and, IF, profitable was lucky. IF, you truly watched price action it was running 10+pts up and down ranges so fast that it was very difficult trading conditions.
Let's talk about this week!
--------------------------------------------------------------------------------------------------------------
I have tried to clean up the weekly chart to keep it as simple as possible since we lost some major levels and are down at early September levels. We did sell off in the after-hours even further down to around 6540. Any loss this evening of that level and reclaim of it in the overnight session, will be a good start for us to back test the levels higher. IF, this is just a regular buy the dip after a sell off, we should be able to reclaim 6740 and hold 6680 by end of the week. The strength over the next couple of weeks will really determine, IF, we can continue the bull run above 6813. We have not had 2 red weeks back-to-back since the April low. We have to take price day to day and week to week. Overall, we are still in a bullish trend and that really won't change until we lose 6300 level as first big warning sign. Until then, we need to expect a buy the dip regime to continue!
When ES sells off the way it did, we have a very high probability that a short squeeze is coming in the next day or so.
How do we ride with the institutions for the back test of the loss of the 6762-66 level?
We find good levels that we can enter at and ride price higher.
Key Support Levels - 6540, 6510, 6485, 6460, 6430, 6421, 6371
Key Resistance Levels - 6551, 6575, 6588, 6611, 6626, 6665, 6680, 6705, 6740
Ideally, we will start to build a base below 6540 overnight and then we can catch the reclaim of that level for a move higher. I could also see us lose 6540, flush down to 6510 or 6485, bounce to retest the 6540 level, come back down overnight, get everyone scared it's going to flush again and then provide a massive, short squeeze.
IF, price does reclaim 6540, the reclaim of 6575, 6588, 6611 are next 3 levels above that we can try and find some structure built at for a move up the levels.
I have no idea what price will do at the open and during the overnight session. I will post my Daily Trade Plan by 6am EST after the overnight session to get a sense for what levels we want to try, and grab points out of tomorrow.
-------------------------------------------------------------------------------------------------------------
Purple Levels - Weekly High/Low
Green Levels - Weekly Targets
Yellow Levels - Daily Key Levels (See Daily Trade Plan)
White - Trendlines that may produce support/resistance alongside the horizontal trendlines
Related publications
Disclaimer
The information and publications are not meant to be, and do not constitute, financial, investment, trading, or other types of advice or recommendations supplied or endorsed by TradingView. Read more in the Terms of Use.
Related publications
Disclaimer
The information and publications are not meant to be, and do not constitute, financial, investment, trading, or other types of advice or recommendations supplied or endorsed by TradingView. Read more in the Terms of Use.