October 8th- 6:55am EST
*Before reading this trade plan, IF, you did not read yesterdays, or the Weekly Trade Plan take the time to read it first! (You can see both posts in the related publication section) *
If my posts provide quality information that has helped you with your trading journey. Feel free to boost it for others to find and learn, also!
My daily trade plan and real-time notes that I post are intended for myself to easily be able to go back and review my plan and how I did from an execution perspective.
-----------------------------------------------------------------------------------------------------------------
Yesterday, I stated the following in my trade plan "IF, price rallies above 6792 (Overnight High) and then comes back into the overnight range after the NYSE Open, and ES starts to sell off fast, DO NOT try and RUSH into grabbing points. Wait for it to build a base at one of the levels outlined above."
What happened when we made a high around 6802 at 9am and price fell back into the range? We sold off and anyone that was not patiently waiting on levels below with a good entry strategy, would not have been profitable. You can review my real-time notes on the 2 trades that I took and can also play back the price action and see that we hit the 6747 green level exactly and have been moving higher since that low yesterday.
------------------------------------------------------------------------------------------------------------------
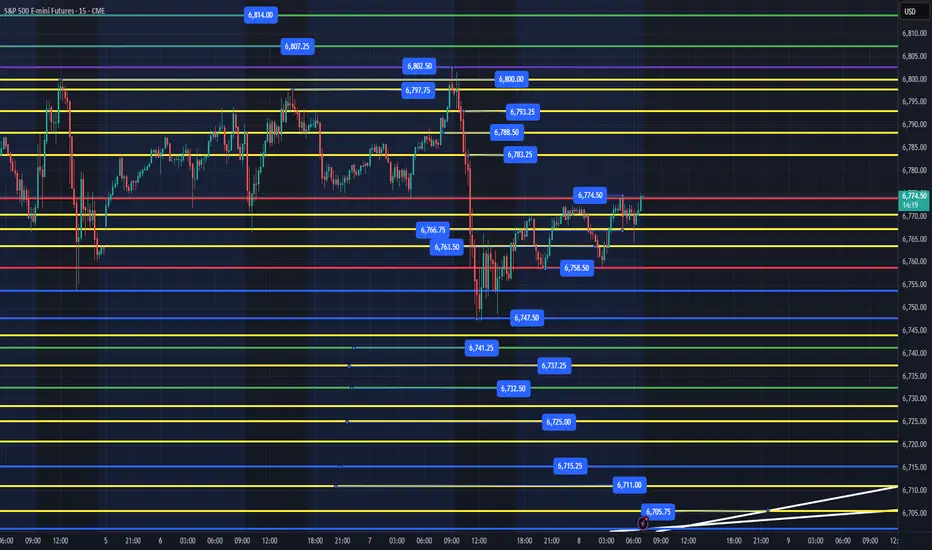
Let's get into today! You can look at the 15 min chart and see a nice set of higher highs, higher lows since the low yesterday. What does that mean? We can easily understand that the trend is up and until that most recent lower low is taken out, we should continue higher.
We are coming into the overnight high of 6774 and our low of overnight session is at 6758. IF, price can clear 6774, we should back test the 6783 level. Any loss of 6763 is a warning sign that we could head lower and a loss of 6758 would most likely produce a retest of the 6747 low.
Highest quality setups are the following:
1. Flush 6758 and reclaim for a move higher
2. Flush of 6747 (down to 6741-43) and reclaim for a move higher
3. Flush of 6741 (down to 6737, 6732) and reclaim for a move higher
These are the 3 main levels; I am looking to grab points from.
Key Support Levels - 6763, 6758, 6747, 6741, 6732, 6715, 6705
Key Resistance Levels - 6774, 6783, 6792, 6800, 6807+
IF, price rallies above 6774 (Overnight High) and then comes back into the overnight range after the NYSE Open, and ES starts to sell off fast, DO NOT try and RUSH into grabbing points. Wait for it to build a base at one of the levels outlined above.
I will post an update around 10am EST.
----------------------------------------------------------------------------------------------------------------
Couple of things about how I color code my levels.
1. Purple shows the weekly Low
2. Red shows the current overnight session High/Low (time of post)
3. Blue shows the previous day's session Low (also other previous day's lows)
4. Yellow Levels are levels that show support and resistance levels of interest.
5. White shows the trendline from the August lows
*Before reading this trade plan, IF, you did not read yesterdays, or the Weekly Trade Plan take the time to read it first! (You can see both posts in the related publication section) *
If my posts provide quality information that has helped you with your trading journey. Feel free to boost it for others to find and learn, also!
My daily trade plan and real-time notes that I post are intended for myself to easily be able to go back and review my plan and how I did from an execution perspective.
-----------------------------------------------------------------------------------------------------------------
Yesterday, I stated the following in my trade plan "IF, price rallies above 6792 (Overnight High) and then comes back into the overnight range after the NYSE Open, and ES starts to sell off fast, DO NOT try and RUSH into grabbing points. Wait for it to build a base at one of the levels outlined above."
What happened when we made a high around 6802 at 9am and price fell back into the range? We sold off and anyone that was not patiently waiting on levels below with a good entry strategy, would not have been profitable. You can review my real-time notes on the 2 trades that I took and can also play back the price action and see that we hit the 6747 green level exactly and have been moving higher since that low yesterday.
------------------------------------------------------------------------------------------------------------------
Let's get into today! You can look at the 15 min chart and see a nice set of higher highs, higher lows since the low yesterday. What does that mean? We can easily understand that the trend is up and until that most recent lower low is taken out, we should continue higher.
We are coming into the overnight high of 6774 and our low of overnight session is at 6758. IF, price can clear 6774, we should back test the 6783 level. Any loss of 6763 is a warning sign that we could head lower and a loss of 6758 would most likely produce a retest of the 6747 low.
Highest quality setups are the following:
1. Flush 6758 and reclaim for a move higher
2. Flush of 6747 (down to 6741-43) and reclaim for a move higher
3. Flush of 6741 (down to 6737, 6732) and reclaim for a move higher
These are the 3 main levels; I am looking to grab points from.
Key Support Levels - 6763, 6758, 6747, 6741, 6732, 6715, 6705
Key Resistance Levels - 6774, 6783, 6792, 6800, 6807+
IF, price rallies above 6774 (Overnight High) and then comes back into the overnight range after the NYSE Open, and ES starts to sell off fast, DO NOT try and RUSH into grabbing points. Wait for it to build a base at one of the levels outlined above.
I will post an update around 10am EST.
----------------------------------------------------------------------------------------------------------------
Couple of things about how I color code my levels.
1. Purple shows the weekly Low
2. Red shows the current overnight session High/Low (time of post)
3. Blue shows the previous day's session Low (also other previous day's lows)
4. Yellow Levels are levels that show support and resistance levels of interest.
5. White shows the trendline from the August lows
Note
9:42am - UpdateI wanted to point out that we have been in a 10pt range between 6766-6776 since the European open. IF, you have tried to make a trade this am, you are gambling and not trading. There is no reason anyone should have FOMO the way price has been acting. Wait patiently for your key levels that can get you some quality points. IF, you are patiently waiting then congratulations. You will be rewarded if you continue to wait for price to come to you!
Note
10:20am - Price finally broke through 6774 overnight and has rallied quickly into levels above. When price moves up quickly, it is easy to chase and feel like you missed out on a move. The reality is that price typically does not rally without consolidating for its next move. The question is going to be where can the consolidation take place? IF, this move is bullish, we should be able to hold the 6780-83 and flag out. 6774-76 is next level for a back test and IF, price can't hold this level, and we head back into the overnight range, I would be getting out the way and waiting on price to find one of the daily trade plan levels for some points. Note
11:18am - Price action has been trying to continue higher with price currently at 6793. IF, price loses 6780, we will most likely sell off. IF, price holds 6780 and breaks above 6793, then we should move higher to retest 6802 and then levels above. I will provide another update after lunch based on what price is doing. We rallied this am and my edge did not present itself and now we need to be patient and wait for price to come back to levels in my trade plan. Note
12:28pm - UpdateIF, you zoom out on the chart to a higher time frame and even down to a 1-hour time frame, you can clearly see that Institutions have been buying any dips below 6750-6765 and we then sold off 2x at the 6802 zone. IF, price can clear this level and hold we should have a new range between 6800 - 6850. I still think we can get one more pull back before we go higher. I am going to take the afternoon off and let price this afternoon decide what it wants to do and will look for new entry's tomorrow. IF, price does lose the 6750-56 level on any pullback, that would be bearish and a warning to the bigger/current market structure. Price really should not lose 6770-74, with 6760-63 being the very lowest, IF, price wants to continue higher.
Related publications
Disclaimer
The information and publications are not meant to be, and do not constitute, financial, investment, trading, or other types of advice or recommendations supplied or endorsed by TradingView. Read more in the Terms of Use.
Related publications
Disclaimer
The information and publications are not meant to be, and do not constitute, financial, investment, trading, or other types of advice or recommendations supplied or endorsed by TradingView. Read more in the Terms of Use.