September 12th - 6:15am EST
Yesterday we had great trading conditions, and we have exceeded our weekly targets! I wrote at 5:50am EST in my trade plan the following - (You can see it in the related publication section)
"Overnight low is 6534 and high is 6551 as of writing. We have to remain bullish until proven otherwise, so the targets above at 6567, 6578 and if it really wants it can get to 6592. I have said that the white trend line is a magnet that we are heading towards. We just don't know what route price will take to achieve its targets. We focus on our process and edge to take points out of the market daily."
There were 2 key takeaways from this that I want to point out.
1. 6551 was the overnight session high at time of writing. It also became a key support that took us higher after 9:30am. You can see on the 15 min chart a nice consolidation of price that held until breaking out.
2. My initial targets of 6567, 6578 were met, we blew past the white trend line magnet and then ripped past my target of 6592 and the high of the day was 6600.
6600 on ES & 46,000 on DOW are big round numbers! You should never be bearish when the trend is up, I do think we can be cautious for many reasons. September is typically a bearish month, Fed Cutting rates will actually be bearish, not bullish, Employment rate is going higher, Credit Card delinquencies are higher, Auto Payment delinquencies are higher, etc., etc., etc.
Those reasons are data, news, opinions and not how we make money on a daily basis trading ES. As we all know, Institutions make money on news events, by using those events to scare retail investors into a bearish mindset, sell price down to key levels that they can run stops, grab liquidity, and then ride the market higher. It's called accumulation and distribution.
------------------------------------------------------------------------------------------------------------------
Let's get into today's trading plan!
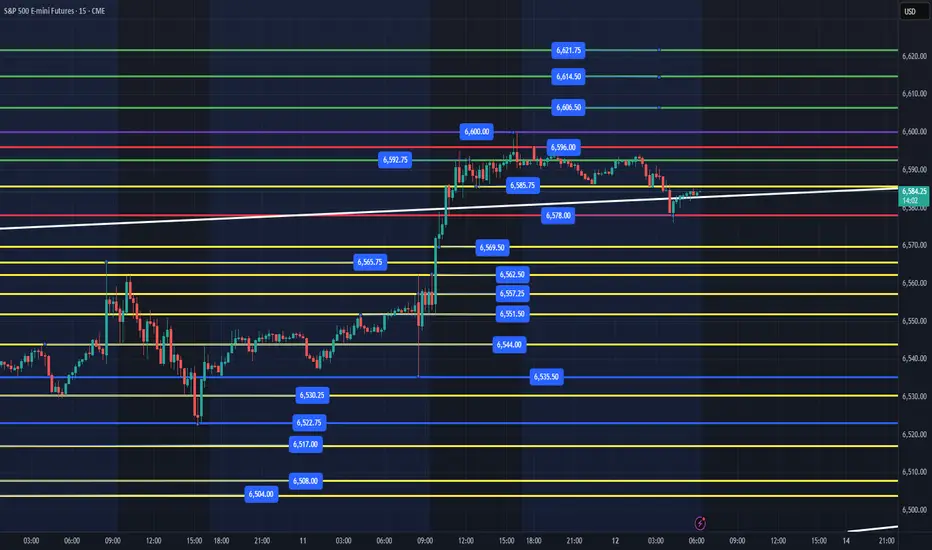
Overnight low is 6576 and high is 6596. We have been going sideways overnight and into the white trend line magnet. We are currently grinding slowly across the white trendline as I write this plan. After a healthy 65pt move yesterday, price needs to settle and figure out what it wants to do. While we don't care what price decides to do or the path it takes, we will just focus on what levels do we think have the highest probability of flushing, reclaiming and driving us higher to the next level. (Why? I do NOT SHORT ES, I LONG areas that liquidity will be present and institutions are buying at).
Key Support Levels - 6576, 6569, 6562, 6551, 6535, 6522
Key Resistance Levels - 6585, 6592, 6596, 6600
Upside targets above are 6606, 6614, 6621+
Key Levels to watch for price opportunities:
1. Overnight low at 6576. This area was tested and really has not given us much of a bounce, so not sure there is much liquidity left in the tank when we test it again.
2. 6562, flush and reclaim to back test 6576 and potentially keep going higher.
3. 6551, flush and reclaim to back test 6576 and potentially keep going higher.
IF, price breaks below 6551, I will only be focused on the flush and reclaim of the levels in blue below at 6535, 6522. This could be 6530, reclaim 6535 or 6517, reclaim 6522.
IF, price can flush and reclaim the red or blue levels, those are always my highest quality spots I am looking to ride higher. The yellow levels are very important support and resistance levels that you can get reclaims of and move higher. They can also be choppy and harder to enter without a short time frame edge for entry. It is all based on your strategy, goals and edge of getting points from ES.
I will post an update around 10am after the NYSE open.
---------------------------------------------------------------------------------------------------------------------
Couple of things about how I color code my levels.
1. Purple shows the weekly High/Low
2. Red shows the current overnight session High/Low (time of post)
3. Blue shows the previous day's session Low (also other previous day's lows)
4. Yellow Levels are levels that show support and resistance levels of interest.
5. White shows the trendline from the August lows.
Yesterday we had great trading conditions, and we have exceeded our weekly targets! I wrote at 5:50am EST in my trade plan the following - (You can see it in the related publication section)
"Overnight low is 6534 and high is 6551 as of writing. We have to remain bullish until proven otherwise, so the targets above at 6567, 6578 and if it really wants it can get to 6592. I have said that the white trend line is a magnet that we are heading towards. We just don't know what route price will take to achieve its targets. We focus on our process and edge to take points out of the market daily."
There were 2 key takeaways from this that I want to point out.
1. 6551 was the overnight session high at time of writing. It also became a key support that took us higher after 9:30am. You can see on the 15 min chart a nice consolidation of price that held until breaking out.
2. My initial targets of 6567, 6578 were met, we blew past the white trend line magnet and then ripped past my target of 6592 and the high of the day was 6600.
6600 on ES & 46,000 on DOW are big round numbers! You should never be bearish when the trend is up, I do think we can be cautious for many reasons. September is typically a bearish month, Fed Cutting rates will actually be bearish, not bullish, Employment rate is going higher, Credit Card delinquencies are higher, Auto Payment delinquencies are higher, etc., etc., etc.
Those reasons are data, news, opinions and not how we make money on a daily basis trading ES. As we all know, Institutions make money on news events, by using those events to scare retail investors into a bearish mindset, sell price down to key levels that they can run stops, grab liquidity, and then ride the market higher. It's called accumulation and distribution.
------------------------------------------------------------------------------------------------------------------
Let's get into today's trading plan!
Overnight low is 6576 and high is 6596. We have been going sideways overnight and into the white trend line magnet. We are currently grinding slowly across the white trendline as I write this plan. After a healthy 65pt move yesterday, price needs to settle and figure out what it wants to do. While we don't care what price decides to do or the path it takes, we will just focus on what levels do we think have the highest probability of flushing, reclaiming and driving us higher to the next level. (Why? I do NOT SHORT ES, I LONG areas that liquidity will be present and institutions are buying at).
Key Support Levels - 6576, 6569, 6562, 6551, 6535, 6522
Key Resistance Levels - 6585, 6592, 6596, 6600
Upside targets above are 6606, 6614, 6621+
Key Levels to watch for price opportunities:
1. Overnight low at 6576. This area was tested and really has not given us much of a bounce, so not sure there is much liquidity left in the tank when we test it again.
2. 6562, flush and reclaim to back test 6576 and potentially keep going higher.
3. 6551, flush and reclaim to back test 6576 and potentially keep going higher.
IF, price breaks below 6551, I will only be focused on the flush and reclaim of the levels in blue below at 6535, 6522. This could be 6530, reclaim 6535 or 6517, reclaim 6522.
IF, price can flush and reclaim the red or blue levels, those are always my highest quality spots I am looking to ride higher. The yellow levels are very important support and resistance levels that you can get reclaims of and move higher. They can also be choppy and harder to enter without a short time frame edge for entry. It is all based on your strategy, goals and edge of getting points from ES.
I will post an update around 10am after the NYSE open.
---------------------------------------------------------------------------------------------------------------------
Couple of things about how I color code my levels.
1. Purple shows the weekly High/Low
2. Red shows the current overnight session High/Low (time of post)
3. Blue shows the previous day's session Low (also other previous day's lows)
4. Yellow Levels are levels that show support and resistance levels of interest.
5. White shows the trendline from the August lows.
Note
9:50am - IF, price can clear 6593, we should continue higher to the targets above. IF, we lose the white trendline around 6580-82, we will probably lose the overnight low and could get a short squeeze. I would be patient, but any flush and reclaim of 6578 will be my first place to grab points. 6565 and reclaim of 6569 for a back test of 6578. Also, everything on the trade plan above is still intact for today, so far! I will send another note IF, price moves above 6593 or below 6580-82 area.
Note
11am - UpdatePrice spiked above the overnight high at 6596. While we should continue higher to the targets in my plan. IF, price can't hold above 6585, we could flush lower. I would not be chasing, IF, you're in a position, let it run up the levels with a stop below previous 15 min candle and manage your risk accordingly.
Note
3:24pm - Update We had a great week with targets being hit! Price was very choppy today with no pullback that I was looking for to make a trade. We did hit 6586 at 11:48 and then rallied the rest of the day and price clipped the 6606.50 target at 2:51pm. This narrow range between 8:30am-12pm is not typical in ES. While we do chop around, we usually get a decent place to make an entry. 6585 would have been the only place to enter today, but it was not on my trading plan, so I left it alone. Big week with Fed meeting and ES contract roll over. I will send out my weekly plan on Sunday along with the daily trade plan, most likely Monday am around 6am since we are looking to close at the highs of the range. Have a great weekend!
Related publications
Disclaimer
The information and publications are not meant to be, and do not constitute, financial, investment, trading, or other types of advice or recommendations supplied or endorsed by TradingView. Read more in the Terms of Use.
Related publications
Disclaimer
The information and publications are not meant to be, and do not constitute, financial, investment, trading, or other types of advice or recommendations supplied or endorsed by TradingView. Read more in the Terms of Use.