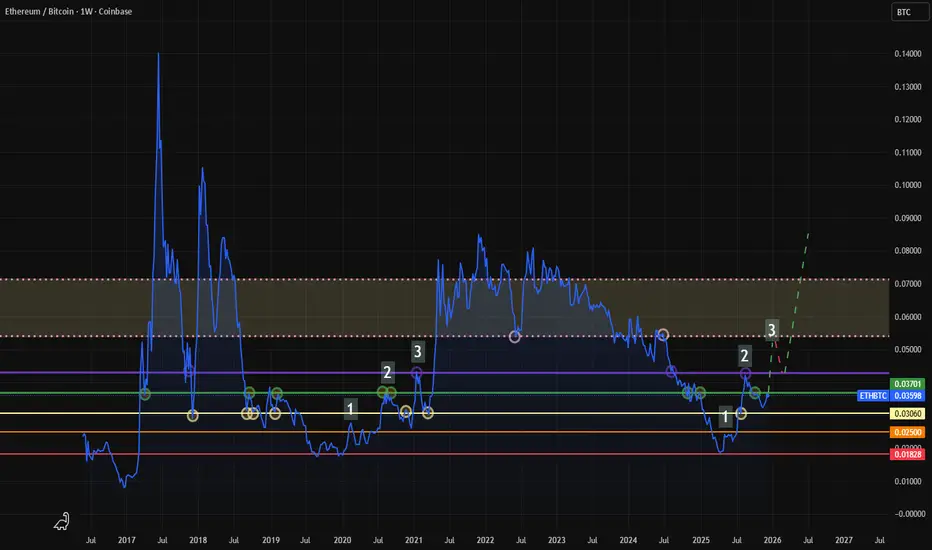
ETHBTC W Pattern Makes the Case for a Macro Bull MarketIt seems pretty clear to me that ETHBTC is in a multi year W pattern. The higher low on the W, with hidden bullish divergence helps confirm the pattern, as does the recent price action.
From April to May of 2025 price consolidated in a low and then surged to a local high in August when it the oran
Related coins

eth btc - a macro alt market indicatoreth btc - a macro alt market indicator
not so sure its a great one anymore. eth imo is pretty much a chinese scam. if you look back into its history and vitalik getting funded just as they were going to go under, then of course it became the second big trading pair after btc and took over.
not sur

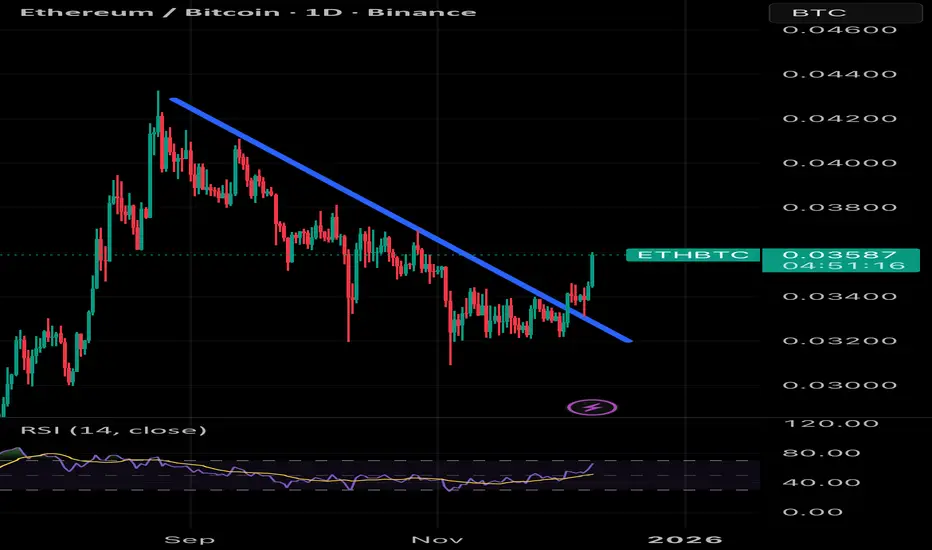
ETHEREUM/BITCOIN riseETH/BTC has broken above the trendline, closed the weekly candle above it, and backtested it. Now it's time for Ethereum to outperform. This is interesting for altcoins.

ETH/BTC showing recovery Upcoming 6 months will be Exciting for Eth & Alts.
Eth/Btc showing reversal signs.
New year brings new life to Altcoins.

ETHEREUM BITCOIN (BEST-CASE)CRYPTOCAP:ETH is the main platform for thousands of apps and blockchains, all powered by the Ethereum protocol.
This vibrant ecosystem fuels innovation and a wide range of decentralized apps and services.
Free and global Ethereum accounts
Pseudo-private, no personal information needed
Without

ETH/BTC 6 hour Coinbase ChartETH/BTC Just closed a 6 hour candle at 0.03452 the same close 18 hours ago, but a higher wick than the previous close. The RSI is was higher this last 6 hour period. The Chaikin Oscillator sits at 0 with my settings.
I’m not predicting anything, it’s just an interesting observation. I will remain

$ETHBTC: Weekly trend turning bullish again...Good afternoon lads,
Ethereum vs Bitcoin is now bullish in the short and mid term and can trigger a monthly timeframe trend soon if strength persists in the coming month.
Sentiment had reached the depths of hell by Friday Nov 21st, when I was at the Devconnect event, chatting with traders and peop
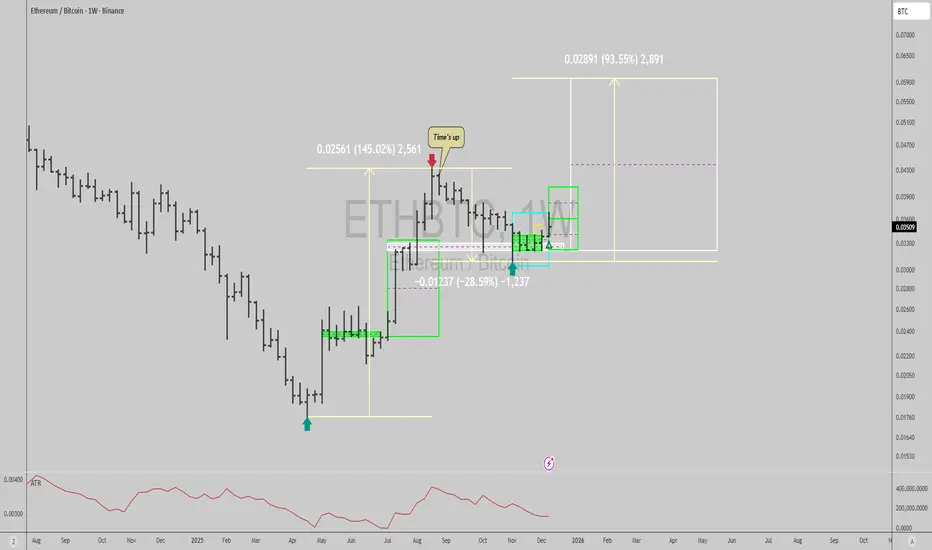
ETHBTC - HTF 3 Wave Buildup + Key Support & ResistanceMost important chart in crypto right now.
Be positioned before 0.043
Buy any dips after the Santa Rally down to current resistance 0.037
Distribute/TP within the shaded box area
$ETH / $BTC Breakout on Daily TimeframeETH/BTC has appeared to breakout on the daily timeframe, with a successful backtest and continuation higher. This is a great sign for alts in general, but remaining cautious with all the volatility that comes with FOMC decisions. Would like to see this hold and have a strong weekly close to give a c
ETH/BTC MULTI MONTH HIDDEN BULLISH DIVERGENCEETH could be gearing up for continued outperformance against BTC. This with BTC.D set to decline, gives the bulls ammo to push alts higher.

See all ideas
Summarizing what the indicators are suggesting.
Oscillators
Neutral
SellBuy
Strong sellStrong buy
Strong sellSellNeutralBuyStrong buy
Oscillators
Neutral
SellBuy
Strong sellStrong buy
Strong sellSellNeutralBuyStrong buy
Summary
Neutral
SellBuy
Strong sellStrong buy
Strong sellSellNeutralBuyStrong buy
Summary
Neutral
SellBuy
Strong sellStrong buy
Strong sellSellNeutralBuyStrong buy
Summary
Neutral
SellBuy
Strong sellStrong buy
Strong sellSellNeutralBuyStrong buy
Moving Averages
Neutral
SellBuy
Strong sellStrong buy
Strong sellSellNeutralBuyStrong buy
Moving Averages
Neutral
SellBuy
Strong sellStrong buy
Strong sellSellNeutralBuyStrong buy
Displays a symbol's price movements over previous years to identify recurring trends.