ETH/USDT Weekly Chart Analysis.
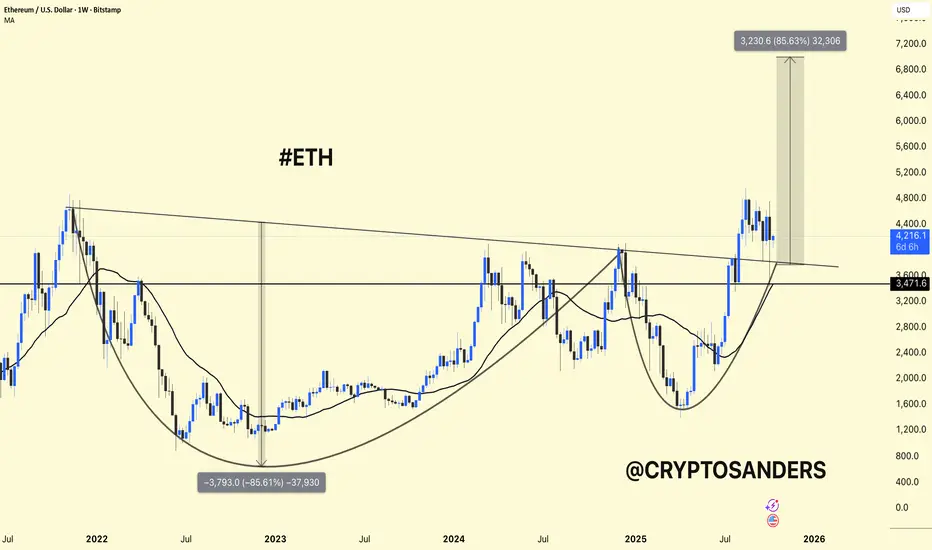
Structure: The chart shows a large cup-and-handle pattern – a classic bullish formation that signals a long-term trend reversal.
Current Price: Around $4,150, trading above the $3,470-$3,600 support area, which was the previous breakout area.
Moving Average (MA): ETH remains above the weekly MA (~$3,460) – confirming bullish momentum.
Breakout Area: The key downtrend line of 2022 has already been broken to the upside, showing strength.
Upside Target: If ETH maintains a price above $3,600, a potential upside move towards $7,000-$7,200 (≈ approximately +85%) is possible, as shown in the chart.
ETH is consolidating after its breakout, remaining stable above its support level.
Holding $3,600 → Bullish momentum likely to continue.
Loss of $3,400 → Could trigger a deeper decline towards $3,000.
DYOR | NFA
Related publications
Disclaimer
The information and publications are not meant to be, and do not constitute, financial, investment, trading, or other types of advice or recommendations supplied or endorsed by TradingView. Read more in the Terms of Use.
Related publications
Disclaimer
The information and publications are not meant to be, and do not constitute, financial, investment, trading, or other types of advice or recommendations supplied or endorsed by TradingView. Read more in the Terms of Use.