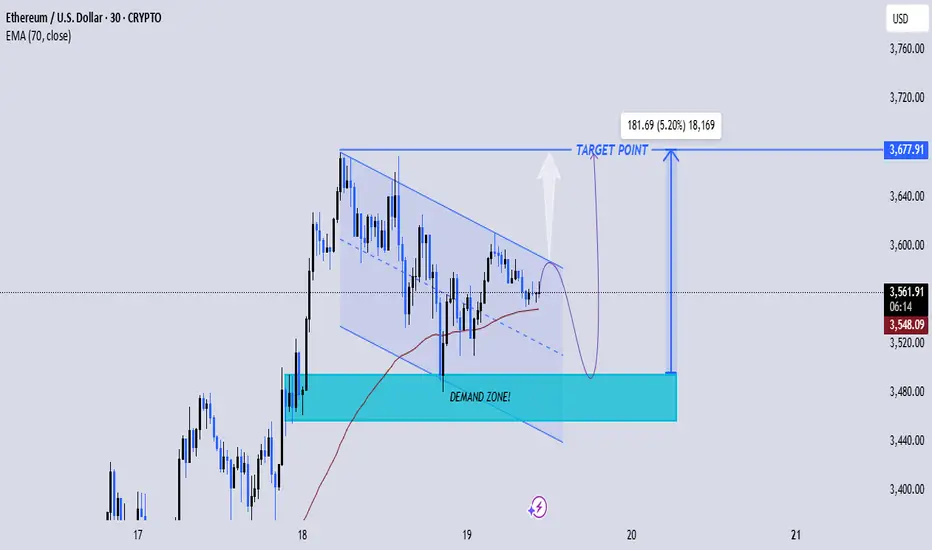
ETH/USD 30Min Chart Analysis 🧠📊
🔹 Pattern: Descending wedge – a bullish reversal pattern.
🔹 EMA Strategy: Price is hovering near the 70 EMA (3,548.11), acting as dynamic support.
🔹 Demand Zone: Strong support zone around 3,470–3,490, previously respected by buyers.
🔹 Price Action: Consolidation with lower highs & higher lows signals compression before breakout.
🔹 Volume Strategy: Low during consolidation, expected surge on breakout.
🔹 Target: Projected breakout to 3,677.91 (+5.2%) if price respects demand and breaks wedge.
✅ Strategy Suggestion:
Buy setup: If price retests demand zone & forms bullish candle → target 3,677
Confirmation: Breakout above wedge & EMA with strong volume
📈 Bullish bias while price holds above demand zone and 70 EMA
❗Watch for false breakout traps near wedge resistance
Trade closed: target reached
Note
amazing flying fighters hit our target enjoy your big big profits and send me feedbackjoin my tellegram channel
t.me/JaMesGoldFiGhteR786
join my refferal broker
one.exnesstrack.org/a/g565sj1uo7?source=app
t.me/JaMesGoldFiGhteR786
join my refferal broker
one.exnesstrack.org/a/g565sj1uo7?source=app
Disclaimer
The information and publications are not meant to be, and do not constitute, financial, investment, trading, or other types of advice or recommendations supplied or endorsed by TradingView. Read more in the Terms of Use.
join my tellegram channel
t.me/JaMesGoldFiGhteR786
join my refferal broker
one.exnesstrack.org/a/g565sj1uo7?source=app
t.me/JaMesGoldFiGhteR786
join my refferal broker
one.exnesstrack.org/a/g565sj1uo7?source=app
Disclaimer
The information and publications are not meant to be, and do not constitute, financial, investment, trading, or other types of advice or recommendations supplied or endorsed by TradingView. Read more in the Terms of Use.