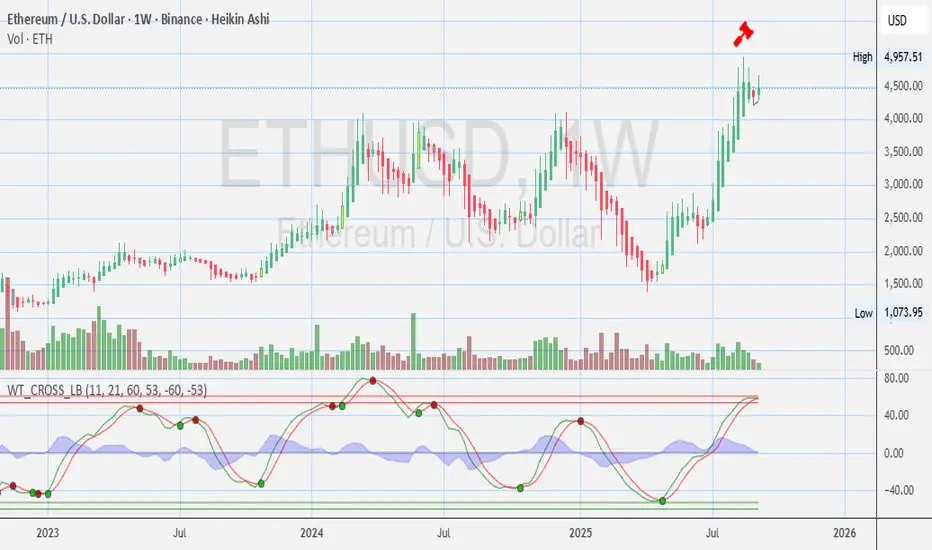
Here’s a breakdown of Ethereum / USD (ETH/USDT, Weekly – Binance, Heikin Ashi) chart:
Trend & Structure
Macro Trend: ETH has been in a strong bullish uptrend since late 2022, recovering from the $800–$1,000 range and pushing toward $4,600+.
Key Resistance: Around $4,950–$5,000 (previous ATH zone from 2021). This level is acting as a major test — a breakout here could confirm continuation to new highs.
Support Levels:
Short-term: $4,200–$4,300 (recent consolidation zone).
Deeper pullback support: $3,500–$3,600 (prior breakout area).
Momentum Indicators (WT Cross / Stoch)
Oscillator is in overbought territory (above 50–60 range) but still pushing upward — this indicates strong bullish momentum but also risk of short-term correction if buyers slow down.
The green signals show momentum continuation, but caution is warranted as we’re near resistance.
Volume
Weekly volume is steady but not at peak levels, suggesting the move may need more accumulation to convincingly break $5,000.
✅ Bullish Case: If ETH breaks and closes above $5,000 on the weekly, it opens the door for price discovery, with next psychological targets around $6,500–$7,000.
⚠️ Bearish Case: Failure to break $5,000 could trigger a retracement back to $4,200 or even $3,600 before another attempt.
--
Disclosures:
This analysis is for informational purposes only and is not financial advice. It does not constitute a recommendation to buy, sell, or trade any securities, cryptocurrencies, or stocks. Trading involves significant risk, and you should consult with a qualified financial advisor before making any investment decisions. Past performance is not indicative of future results.
Disclaimer
The information and publications are not meant to be, and do not constitute, financial, investment, trading, or other types of advice or recommendations supplied or endorsed by TradingView. Read more in the Terms of Use.
Disclaimer
The information and publications are not meant to be, and do not constitute, financial, investment, trading, or other types of advice or recommendations supplied or endorsed by TradingView. Read more in the Terms of Use.